Gallery
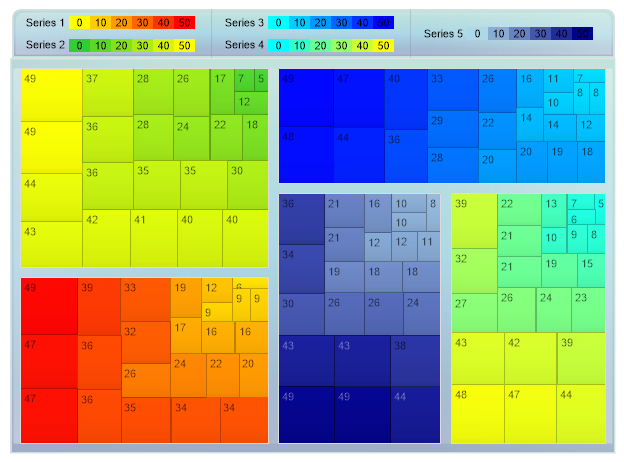
Tree Map Legend Swatches
<%@ Page Language="C#" Description="dotnetCHARTING Component" %>
<%@ Register TagPrefix="dnc" Namespace="dotnetCHARTING" Assembly="dotnetCHARTING" %>
<%@ Import Namespace="System.Drawing" %>
<%@ Import Namespace="System.Drawing.Drawing2D" %>
<%@ Import Namespace="dotnetCHARTING.Mapping" %>
<script runat="server">
void Page_Load(Object sender, EventArgs e)
{
// Demonstrates a TreeMap with individual color swatches for each series.
Chart.Size = "620x450";
Chart.TempDirectory = "temp";
Chart.Debug = true;
Chart.Type = ChartType.TreeMap;
Chart.PaletteName = Palette.FiveColor46;
// Distance between series boxes
Chart.ChartArea.Padding = 10;
Chart.ChartArea.Background.Color = Color.LightBlue;
Chart.ChartArea.Background.ShadingEffectMode = ShadingEffectMode.Background1;
// Because the legend uses absolute positioning, a margin is used to make room for the legend.
Chart.MarginTop = 50;
// Legendbox Styling and position
Chart.LegendBox.DefaultCorner = BoxCorner.Round;
Chart.LegendBox.CornerBottomLeft = BoxCorner.Square;
Chart.LegendBox.CornerBottomRight = BoxCorner.Square;
Chart.LegendBox.Background.Color = Color.LightBlue;
Chart.LegendBox.Background.ShadingEffectMode = ShadingEffectMode.Background1;
Chart.LegendBox.Template = "%Name%Value";
Chart.LegendBox.Position = new Rectangle(new Point(7, 1), new Size(594, 40));
//Element labels and tooltip
Chart.DefaultElement.ToolTip = "%Name";
Chart.DefaultElement.ShowValue = true;
Chart.DefaultElement.SmartLabel.DynamicDisplay = false;
// *DYNAMIC DATA NOTE*
// This sample uses random data to populate the chart. To populate
// a chart with database data see the following resources:
// - Use the getLiveData() method using the dataEngine to query a database.
// - Help File > Getting Started > Data Tutorials
// - DataEngine Class in the help file
// - Sample: features/DataEngine.aspx
SeriesCollection mySC = getRandomData();
// Add the random data.
Chart.SeriesCollection.Add(mySC);
// Add range SmartColors to the smartPalette.
AddSeriesColor(Chart.SmartPalette, Chart.SeriesCollection[0].Name, Color.Yellow,Color.Red);
Chart.SeriesCollection[0].LegendEntry.Value = getSwatch(Chart.SeriesCollection[0].Name, new Size(90, 10), 5, 50);
AddSeriesColor(Chart.SmartPalette, Chart.SeriesCollection[1].Name, Color.LimeGreen, Color.Yellow);
Chart.SeriesCollection[1].LegendEntry.Value = getSwatch(Chart.SeriesCollection[1].Name, new Size(90, 10), 5, 50);
AddSeriesColor(Chart.SmartPalette, Chart.SeriesCollection[2].Name, Color.Aqua, Color.Blue);
Chart.SeriesCollection[2].LegendEntry.Value = getSwatch(Chart.SeriesCollection[2].Name, new Size(90, 10), 5, 50);
AddSeriesColor(Chart.SmartPalette, Chart.SeriesCollection[3].Name, Color.Aqua, Color.Yellow);
Chart.SeriesCollection[3].LegendEntry.Value = getSwatch(Chart.SeriesCollection[3].Name, new Size(90, 10), 5, 50);
AddSeriesColor(Chart.SmartPalette, Chart.SeriesCollection[4].Name, Color.LightBlue, Color.DarkBlue);
Chart.SeriesCollection[4].LegendEntry.Value = getSwatch(Chart.SeriesCollection[4].Name, new Size(90, 10), 5, 50);
}
void AddSeriesColor(SmartPalette sp, string sName, Color c,Color c2)
{
SmartColor sc = new SmartColor(c,c2, new ScaleRange(0, 50));
sc.LegendEntry.Visible = false;
sp.Add(sName, sc);
}
string getSwatch(string name, Size s, int divisions, int max)
{
string result = "";
string spacers = "";
Size boxSize = new Size(s.Width / divisions, s.Height);
for (int i = 0; i <= divisions; i++)
{
spacers += "<Chart:Spacer size='" + boxSize.Width + "x1'>";
string c = getHTMLColor(Chart.SmartPalette.GetValueColor(name, i * max / divisions));
result += "<block hAlign='Center' bgColor='" + c + "'>" + (i * (max / divisions));
}
result = spacers + "<row>" + result;
return result;
}
string getHTMLColor(Color c)
{
return "#" + c.R.ToString("X2") + c.G.ToString("X2") + c.B.ToString("X2");
}
SeriesCollection getRandomData()
{
Random myR = new Random(1);
SeriesCollection SC = new SeriesCollection();
for (int a = 1; a < 6; a++)
{
Series s = new Series("Series " + a.ToString());
for (int b = 1; b < 25; b++)
{
Element e = new Element("Element " + b.ToString());
e.YValue = 5 + myR.Next(45);
s.Elements.Add(e);
}
SC.Add(s);
}
return SC;
}
SeriesCollection getLiveData()
{
DataEngine de = new DataEngine(ConfigurationManager.AppSettings["DNCConnectionString"]);
de.ChartObject = Chart; // Necessary to view any errors the dataEngine may throw.
de.SqlStatement = "SELECT XAxisColumn, YAxisColumn FROM ....";
return de.GetSeries();
}
</script>
<html xmlns="http://www.w3.org/1999/xhtml">
<head>
<title>.netCHARTING Sample</title>
</head>
<body>
<div align="center">
<dnc:Chart ID="Chart" runat="server" />
</div>
</body>
</html>
<%@ Page Language="vb" Description="dotnetCHARTING Component" %>
<%@ Register TagPrefix="dnc" Namespace="dotnetCHARTING" Assembly="dotnetCHARTING" %>
<%@ Import Namespace="System.Drawing" %>
<%@ Import Namespace="System.Drawing.Drawing2D" %>
<%@ Import Namespace="dotnetCHARTING.Mapping" %>
<script runat="server">
Sub Page_Load(ByVal sender As Object, ByVal e As EventArgs)
' Demonstrates a TreeMap with individual color swatches for each series.
Chart.Size = "620x450"
Chart.TempDirectory = "temp"
Chart.Debug = True
Chart.Type = ChartType.TreeMap
Chart.PaletteName = Palette.FiveColor46
' Distance between series boxes
Chart.ChartArea.Padding = 10
Chart.ChartArea.Background.Color = Color.LightBlue
Chart.ChartArea.Background.ShadingEffectMode = ShadingEffectMode.Background1
' Because the legend uses absolute positioning, a margin is used to make room for the legend.
Chart.MarginTop = 50
' Legendbox Styling and position
Chart.LegendBox.DefaultCorner = BoxCorner.Round
Chart.LegendBox.CornerBottomLeft = BoxCorner.Square
Chart.LegendBox.CornerBottomRight = BoxCorner.Square
Chart.LegendBox.Background.Color = Color.LightBlue
Chart.LegendBox.Background.ShadingEffectMode = ShadingEffectMode.Background1
Chart.LegendBox.Template = "%Name%Value"
Chart.LegendBox.Position = New Rectangle(New Point(7, 1), New Size(594, 40))
'Element labels and tooltip
Chart.DefaultElement.ToolTip = "%Name"
Chart.DefaultElement.ShowValue = True
Chart.DefaultElement.SmartLabel.DynamicDisplay = False
' *DYNAMIC DATA NOTE*
' This sample uses random data to populate the chart. To populate
' a chart with database data see the following resources:
' - Use the getLiveData() method using the dataEngine to query a database.
' - Help File > Getting Started > Data Tutorials
' - DataEngine Class in the help file
' - Sample: features/DataEngine.aspx
Dim mySC As SeriesCollection = getRandomData()
' Add the random data.
Chart.SeriesCollection.Add(mySC)
' Add range SmartColors to the smartPalette.
AddSeriesColor(Chart.SmartPalette, Chart.SeriesCollection(0).Name, Color.Yellow,Color.Red)
Chart.SeriesCollection(0).LegendEntry.Value = getSwatch(Chart.SeriesCollection(0).Name, New Size(90, 10), 5, 50)
AddSeriesColor(Chart.SmartPalette, Chart.SeriesCollection(1).Name, Color.LimeGreen, Color.Yellow)
Chart.SeriesCollection(1).LegendEntry.Value = getSwatch(Chart.SeriesCollection(1).Name, New Size(90, 10), 5, 50)
AddSeriesColor(Chart.SmartPalette, Chart.SeriesCollection(2).Name, Color.Aqua, Color.Blue)
Chart.SeriesCollection(2).LegendEntry.Value = getSwatch(Chart.SeriesCollection(2).Name, New Size(90, 10), 5, 50)
AddSeriesColor(Chart.SmartPalette, Chart.SeriesCollection(3).Name, Color.Aqua, Color.Yellow)
Chart.SeriesCollection(3).LegendEntry.Value = getSwatch(Chart.SeriesCollection(3).Name, New Size(90, 10), 5, 50)
AddSeriesColor(Chart.SmartPalette, Chart.SeriesCollection(4).Name, Color.LightBlue, Color.DarkBlue)
Chart.SeriesCollection(4).LegendEntry.Value = getSwatch(Chart.SeriesCollection(4).Name, New Size(90, 10), 5, 50)
End Sub
Sub AddSeriesColor(ByVal sp As SmartPalette, ByVal sName As String, ByVal c As Color, ByVal c2 As Color)
Dim sc As SmartColor = New SmartColor(c,c2, New ScaleRange(0, 50))
sc.LegendEntry.Visible = False
sp.Add(sName, sc)
End Sub
Function getSwatch(ByVal name As String, ByVal s As Size, ByVal divisions As Integer, ByVal max As Integer) As String
Dim result As String = ""
Dim spacers As String = ""
Dim boxSize As Size = New Size(s.Width / divisions, s.Height)
For i As Integer = 0 To divisions
spacers &= "<Chart:Spacer size='" & boxSize.Width & "x1'>"
Dim c As String = getHTMLColor(Chart.SmartPalette.GetValueColor(name, i * max / divisions))
result &= "<block hAlign='Center' bgColor='" & c & "'>" & (i * (max / divisions))
Next i
result = spacers & "<row>" & result
Return result
End Function
Function getHTMLColor(ByVal c As Color) As String
Return "#" & c.R.ToString("X2") + c.G.ToString("X2") + c.B.ToString("X2")
End Function
Function getRandomData() As SeriesCollection
Dim myR As Random = New Random(1)
Dim SC As SeriesCollection = New SeriesCollection()
For a As Integer = 1 To 5
Dim s As Series = New Series("Series " & a.ToString())
For b As Integer = 1 To 24
Dim e As Element = New Element("Element " & b.ToString())
e.YValue = 5 + myR.Next(45)
s.Elements.Add(e)
Next b
SC.Add(s)
Next a
Return SC
End Function
Function getLiveData() As SeriesCollection
Dim de As DataEngine = New DataEngine(ConfigurationManager.AppSettings("DNCConnectionString"))
de.ChartObject = Chart ' Necessary to view any errors the dataEngine may throw.
de.SqlStatement = "SELECT XAxisColumn, YAxisColumn FROM ...."
Return de.GetSeries()
End Function
</script>
<html xmlns="http://www.w3.org/1999/xhtml">
<head>
<title>.netCHARTING Sample</title>
</head>
<body>
<div align="center">
<dnc:Chart ID="Chart" runat="server" />
</div>
</body>
</html>
- Sample FilenameTreeMapLegendSwatches.aspx
- Version6.1
- Uses DatabaseNo