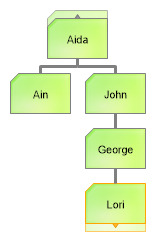
Gallery
Org Indicators
<%@ Page Language="C#" Description="dotnetCHARTING Component" %>
<%@ Register TagPrefix="dnc" Namespace="dotnetCHARTING" Assembly="dotnetCHARTING" %>
<%@ Import Namespace="System.Drawing" %>
<%@ Import Namespace="System.Drawing.Drawing2D" %>
<%@ Import Namespace="dotnetCHARTING.Mapping" %>
<script runat="server">
void Page_Load(Object sender, EventArgs e)
{
// Demonstrates manually adding attributes to draw organizational nodes differently.
Chart.Size = "500x350";
//Chart.Title = ".netCHARTING Sample";
Chart.TempDirectory = "temp";
Chart.Debug = true;
Chart.Type = ChartType.Organizational;
// Set style defaults.
Chart.DefaultSeries.Line.Color = Color.Gray;
Chart.DefaultSeries.Line.Width = 3;
Chart.DefaultElement.Annotation = new Annotation();
Chart.DefaultElement.Annotation.Padding = 5;
Chart.DefaultElement.Annotation.Size = new Size(60, 40);
Chart.DefaultElement.Annotation.Background.Color = Color.GreenYellow;
Chart.DefaultElement.Annotation.Background.ShadingEffectMode = ShadingEffectMode.Background2;
// Get Data
SeriesCollection mySC = getLiveData();
// Apply Attributes
// Adding this indicator attribute will draw an indicator pointing up.
mySC[0][0].CustomAttributes.Add("NodeType", "RootWithParents");
// Adding this indicator attribute will draw an indicator pointing down.
mySC[0][4].CustomAttributes.Add("NodeType", "EndNodeWithChildren");
// The annotation's line color controls the indicator appearance.
Annotation an = mySC[0][4].Annotation = new Annotation();
an.Line.Color = Color.Orange;
// Add the random data.
Chart.SeriesCollection.Add(mySC);
}
SeriesCollection getLiveData()
{
// Obtain series data from the database. Note this was created by adding PID (parentid)
// to an existing table only, then populating the parentid based on the hiearchy in place.
DataEngine de = new DataEngine(ConfigurationManager.AppSettings["DNCConnectionString"]);
de.SqlStatement = @"SELECT * FROM Employees ";
//Select only some users
de.SqlStatement += " WHERE Name LIKE 'Aida' OR Name LIKE 'Ain' OR Name LIKE 'John' OR Name LIKE 'George' OR Name LIKE 'Lori' ";
de.DataFields = "InstanceID=ID,InstanceParentID=PID,Name=Name,office,Department,Email,Phone,Picture";
return de.GetSeries();
}
</script>
<html xmlns="http://www.w3.org/1999/xhtml">
<head>
<title>.netCHARTING Sample</title>
</head>
<body>
<div align="center">
<dnc:Chart ID="Chart" runat="server" />
</div>
</body>
</html>
<%@ Page Language="vb" Description="dotnetCHARTING Component" %>
<%@ Register TagPrefix="dnc" Namespace="dotnetCHARTING" Assembly="dotnetCHARTING" %>
<%@ Import Namespace="System.Drawing" %>
<%@ Import Namespace="System.Drawing.Drawing2D" %>
<%@ Import Namespace="dotnetCHARTING.Mapping" %>
<script runat="server">
Sub Page_Load(ByVal sender As Object, ByVal e As EventArgs)
' Demonstrates manually adding attributes to draw organizational nodes differently.
Chart.Size = "500x350"
'Chart.Title = ".netCHARTING Sample";
Chart.TempDirectory = "temp"
Chart.Debug = True
Chart.Type = ChartType.Organizational
' Set style defaults.
Chart.DefaultSeries.Line.Color = Color.Gray
Chart.DefaultSeries.Line.Width = 3
Chart.DefaultElement.Annotation = New Annotation()
Chart.DefaultElement.Annotation.Padding = 5
Chart.DefaultElement.Annotation.Size = New Size(60, 40)
Chart.DefaultElement.Annotation.Background.Color = Color.GreenYellow
Chart.DefaultElement.Annotation.Background.ShadingEffectMode = ShadingEffectMode.Background2
' Get Data
Dim mySC As SeriesCollection = getLiveData()
' Apply Attributes
' Adding this indicator attribute will draw an indicator pointing up.
mySC(0)(0).CustomAttributes.Add("NodeType", "RootWithParents")
' Adding this indicator attribute will draw an indicator pointing down.
mySC(0)(4).CustomAttributes.Add("NodeType", "EndNodeWithChildren")
' The annotation's line color controls the indicator appearance.
Dim an As Annotation = New Annotation()
an = mySC(0)(4).Annotation
an.Line.Color = Color.Orange
' Add the random data.
Chart.SeriesCollection.Add(mySC)
End Sub
Function getLiveData() As SeriesCollection
' Obtain series data from the database. Note this was created by adding PID (parentid)
' to an existing table only, then populating the parentid based on the hiearchy in place.
Dim de As DataEngine = New DataEngine(ConfigurationManager.AppSettings("DNCConnectionString"))
de.SqlStatement = "SELECT * FROM Employees "
'Select only some users
de.SqlStatement &= " WHERE Name LIKE 'Aida' OR Name LIKE 'Ain' OR Name LIKE 'John' OR Name LIKE 'George' OR Name LIKE 'Lori' "
de.DataFields = "InstanceID=ID,InstanceParentID=PID,Name=Name,office,Department,Email,Phone,Picture"
Return de.GetSeries()
End Function
</script>
<html xmlns="http://www.w3.org/1999/xhtml">
<head>
<title>.netCHARTING Sample</title>
</head>
<body>
<div align="center">
<dnc:Chart ID="Chart" runat="server" />
</div>
</body>
</html>
- Sample FilenameOrgIndicators.aspx
- Version5.3
- Uses DatabaseYes