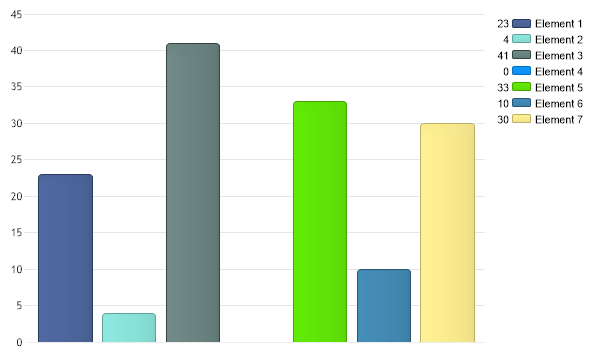
Gallery
Color By Elements
<%@ Page Language="C#" Description="dotnetCHARTING Component" %>
<%@ Register TagPrefix="dotnet" Namespace="dotnetCHARTING" Assembly="dotnetCHARTING"%>
<%@ Import Namespace="System.Drawing" %>
<script runat="server">
void Page_Load(Object sender,EventArgs e)
{
// This sample wil demonstrate how you can color an element in each series so you can do without the x axis.
Chart.Type = ChartType.Combo;//Horizontal;
Chart.Width = 600;
Chart.Height = 350;
Chart.TempDirectory = "temp";
Series mySeries = getRandomData();
// By setting a palette to this series it will instruct the chart engine to color each of it's elements
// and place each element into the legend and remove the series.
mySeries.PaletteName = Palette.Two;
// Now we can remove the x axis by hiding it.
Chart.XAxis.ClearValues = true;
Chart.XAxis.DefaultTick.Line.Length = 0;
// For fun lets also add some shading to the bars.
//Chart.ShadingEffectMode = ShadingEffectMode.Two;
// Add the random data.
Chart.SeriesCollection.Add(mySeries);
}
Series getRandomData()
{
Random myR = new Random();
Series s = new Series();
s.Name = "Clicks";
for(int b = 1; b < 8; b++)
{
Element e = new Element();
e.Name = "Element " + b;;
e.YValue = myR.Next(50);
s.Elements.Add(e);
}
return s;
}
</script>
<html xmlns="http://www.w3.org/1999/xhtml">
<head>
<title>Color By Element</title>
</head>
<body>
<div style="text-align:center">
<dotnet:Chart id="Chart" runat="server"/>
</div>
</body>
</html>
<%@ Page Language="vb" Description="dotnetCHARTING Component" %>
<%@ Register TagPrefix="dotnet" Namespace="dotnetCHARTING" Assembly="dotnetCHARTING"%>
<%@ Import Namespace="System.Drawing" %>
<script runat="server">
Sub Page_Load(ByVal sender As Object, ByVal e As EventArgs)
' This sample wil demonstrate how you can color an element in each series so you can do without the x axis.
Chart.Type = ChartType.Combo 'Horizontal;
Chart.Width = 600
Chart.Height = 350
Chart.TempDirectory = "temp"
Dim mySeries As Series = getRandomData()
' By setting a palette to this series it will instruct the chart engine to color each of it's elements
' and place each element into the legend and remove the series.
mySeries.PaletteName = Palette.Two
' Now we can remove the x axis by hiding it.
Chart.XAxis.ClearValues = True
Chart.XAxis.DefaultTick.Line.Length = 0
' For fun lets also add some shading to the bars.
'Chart.ShadingEffectMode = ShadingEffectMode.Two;
' Add the random data.
Chart.SeriesCollection.Add(mySeries)
End Sub
Function getRandomData() As Series
Dim myR As Random = New Random()
Dim s As Series = New Series()
s.Name = "Clicks"
For b As Integer = 1 To 7
Dim e As Element = New Element()
e.Name = "Element " & b
e.YValue = myR.Next(50)
s.Elements.Add(e)
Next b
Return s
End Function
</script>
<html xmlns="http://www.w3.org/1999/xhtml">
<head>
<title>Color By Element</title>
</head>
<body>
<div style="text-align:center">
<dotnet:Chart id="Chart" runat="server"/>
</div>
</body>
</html>
- Sample FilenameColorByElements.aspx
- VersionLegacy (Pre 3.0)
- Uses DatabaseNo