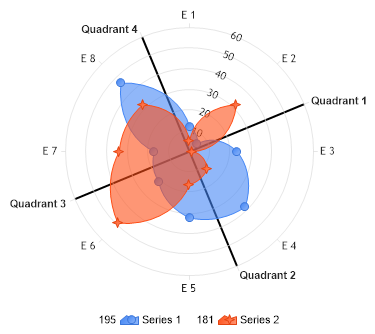
void Page_Load(Object sender, EventArgs e) { // Demonstrates dividing a radar graph into quadrants.
Chart.Size = "600x350"; //Chart.Title = ".netCHARTING Sample"; Chart.TempDirectory = "temp"; Chart.Type = ChartType.Radar; Chart.Debug = true; Chart.XAxis.Scale = Scale.Normal; Chart.LegendBox.Position = LegendBoxPosition.BottomMiddle; // *DYNAMIC DATA NOTE* // This sample uses random data to populate the chart. To populate // a chart with database data see the following resources: // - Use the getLiveData() method using the dataEngine to query a database. // - Help File > Getting Started > Data Tutorials // - DataEngine Class in the help file // - Sample: features/DataEngine.aspx
SeriesCollection mySC = getRandomData();
// This sample works by using a numeric x axis but overwriting each value with an element name. foreach (Element el in mySC[0].Elements) Chart.XAxis.ExtraTicks.Add(new AxisTick(el.XValue, el.Name));
// By doing so, a new axis tick can be added any any particular position on the axis by specifying the axis value. addQuadrantTick(1.5, "Quadrant 1"); addQuadrantTick(3.5, "Quadrant 2"); addQuadrantTick(5.5, "Quadrant 3"); addQuadrantTick(7.5, "Quadrant 4");
// Add the random data. Chart.SeriesCollection.Add(mySC); }
void addQuadrantTick(double val, string name) { AxisTick at = new AxisTick(val, name); at.Line.Length = 5; at.Label.Font = new Font("Arial", 8, FontStyle.Bold); at.GridLine.Width = 2; at.GridLine.Color = Color.Black; Chart.XAxis.ExtraTicks.Add(at); }
SeriesCollection getRandomData() { Random myR = new Random(1); SeriesCollection SC = new SeriesCollection(); for (int a = 1; a < 3; a++) { int i = 0; Series s = new Series("Series " + a.ToString()); for (int b = 1; b < 9; b++) { Element e = new Element("E " + b.ToString()); e.XValue = i++; e.YValue = myR.Next(50); s.Elements.Add(e); } SC.Add(s); } return SC; }
SeriesCollection getLiveData() { DataEngine de = new DataEngine("ConnectionString goes here"); de.ChartObject = Chart; // Necessary to view any errors the dataEngine may throw. de.SqlStatement = "SELECT XAxisColumn, YAxisColumn FROM ...."; return de.GetSeries(); }
Sub Page_Load(ByVal sender As Object, ByVal e As EventArgs) ' Demonstrates dividing a radar graph into quadrants.
Chart.Size = "600x350" 'Chart.Title = ".netCHARTING Sample"; Chart.TempDirectory = "temp" Chart.Type = ChartType.Radar Chart.Debug = True Chart.XAxis.Scale = Scale.Normal Chart.LegendBox.Position = LegendBoxPosition.BottomMiddle ' *DYNAMIC DATA NOTE* ' This sample uses random data to populate the chart. To populate ' a chart with database data see the following resources: ' - Use the getLiveData() method using the dataEngine to query a database. ' - Help File > Getting Started > Data Tutorials ' - DataEngine Class in the help file ' - Sample: features/DataEngine.aspx
Dim mySC As SeriesCollection = getRandomData()
' This sample works by using a numeric x axis but overwriting each value with an element name. For Each el As Element In mySC(0).Elements Chart.XAxis.ExtraTicks.Add(New AxisTick(el.XValue, el.Name)) Next el
' By doing so, a new axis tick can be added any any particular position on the axis by specifying the axis value. addQuadrantTick(1.5, "Quadrant 1") addQuadrantTick(3.5, "Quadrant 2") addQuadrantTick(5.5, "Quadrant 3") addQuadrantTick(7.5, "Quadrant 4")
' Add the random data. Chart.SeriesCollection.Add(mySC) End Sub
Sub addQuadrantTick(ByVal val As Double, ByVal name As String) Dim at As AxisTick = New AxisTick(val, name) at.Line.Length = 5 at.Label.Font = New Font("Arial", 8, FontStyle.Bold) at.GridLine.Width = 2 at.GridLine.Color = Color.Black Chart.XAxis.ExtraTicks.Add(at) End Sub
Function getRandomData() As SeriesCollection Dim myR As Random = New Random(1) Dim SC As SeriesCollection = New SeriesCollection() For a As Integer = 1 To 2 Dim i As Integer = 0 Dim s As Series = New Series("Series " & a.ToString()) For b As Integer = 1 To 8 Dim e As Element = New Element("E " & b.ToString()) e.XValue = i i += 1 e.YValue = myR.Next(50) s.Elements.Add(e) Next b SC.Add(s) Next a Return SC End Function
Function getLiveData() As SeriesCollection Dim de As DataEngine = New DataEngine("ConnectionString goes here") de.ChartObject = Chart ' Necessary to view any errors the dataEngine may throw. de.SqlStatement = "SELECT XAxisColumn, YAxisColumn FROM ...." Return de.GetSeries() End Function