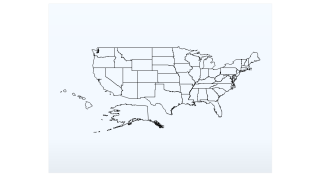
- JS Us Counties Map
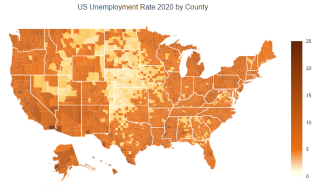
Demonstrates how to use external topoJSON and data files to generate a US counties choropleth map.
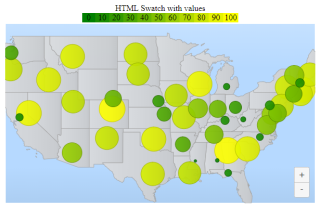
- JS Map With Pies
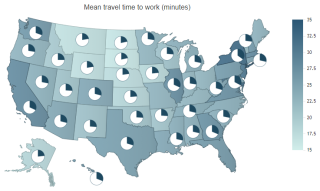
Demonstrates a map with pie microcharts.
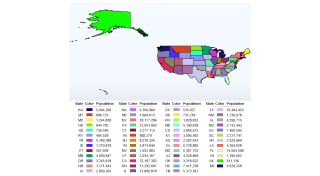
- JS UnemploymentRateUS
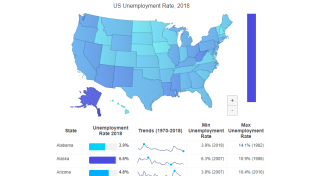
Demonstrates a dashboard with a map and grid with microchart sparklines.
- JS Mapping
Demonstrates a basic js map.Chart.
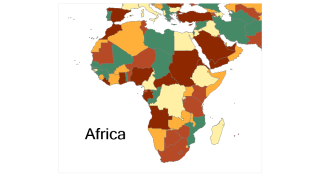
- JS Mapping Africa
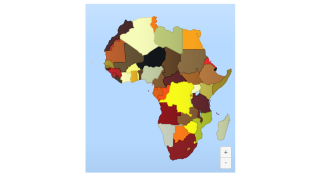
Demonstrates a basic map of africa.Chart.
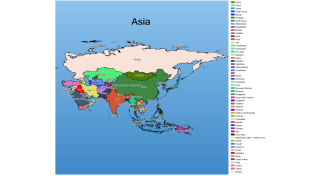
- JS Mapping Asia
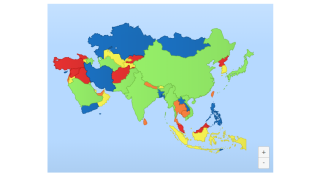
Demonstrates a basic map of asia.Chart.
- JS Mapping Base Layers
Demonstrates base layers as mapping backround for context.Chart.
- JS Mapping Bubble Thematic
Demonstrates using a bubble series on maps leveraging a point geoJSON map file.Chart.
- JS Mapping Context
Demonstrates base layers as mapping backround for context.Chart.
- JS Mapping Data Index
Demonstrates all the available maps.Chart.
- JS Mapping Dynamic
Demonstrates loading maps dynamically through JS.Chart.
- JS Mapping East Coast
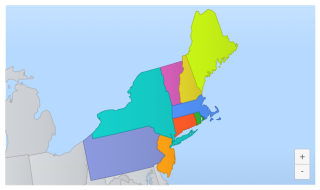
Demonstrates a basic regional map with context.Chart.
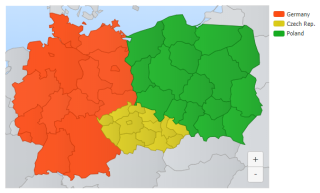
- JS Mapping Election
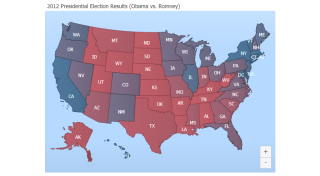
Demonstrates a thmatic election map. Chart.
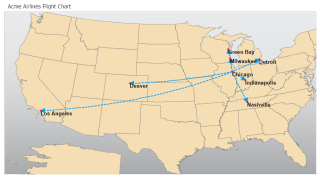
- JS Mapping Lines
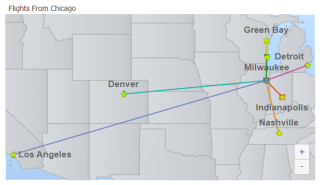
Demonstrates adding line series to maps.Chart.
- JS Mapping Momentary Zoom
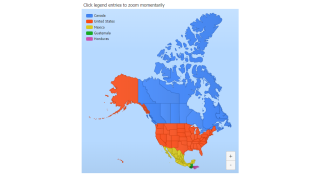
Demonstrates momentary zoom functionality with JS.Chart.
- JS Mapping Thematic Partial
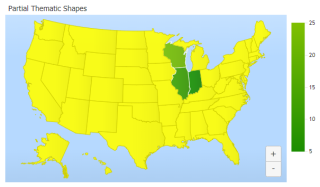
Demonstrates a thematic map with only select elements being counted.Chart.
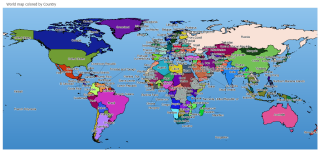
- JS Mapping World
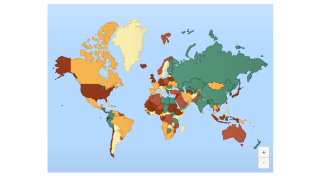
This sample a map of world countries.
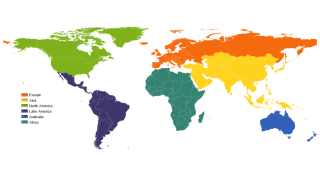
- JS Mapping World Proj
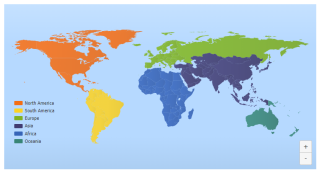
Demonstrates a world map with series for each continent.Chart.
- JS Mapping Zoom To
Demonstrates zooming the chart using map codes.Chart.
- JS MappingZoomUI
Demonstrates controlling the map zoom/pan using JS functions.
- Mapping Earth ecw
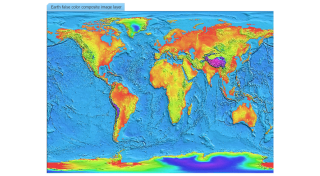
Loading earth.ecw file.
- Mapping World ecw
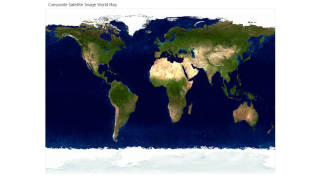
Loading world.ecw file.
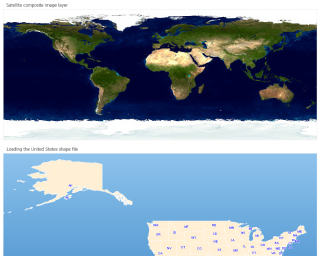
- Mapping United
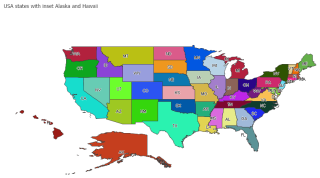
Loading United States shape file.
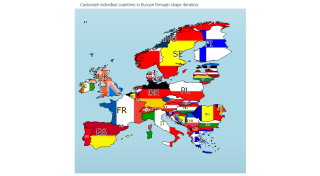
- Mapping Europe
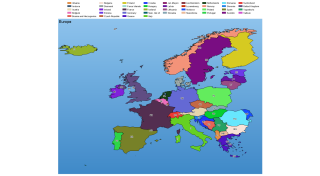
Loading Europe shape file.
- Mapping Asia
Loading Asia shape file.
- Mapping World
Loading World shape file.
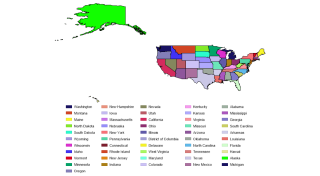
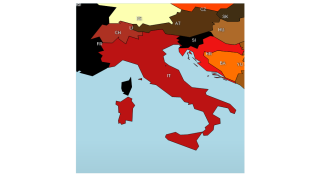
- Mapping
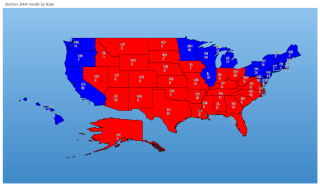
Election 2004 results by states.
- Import Shapefile Data
Demonstrates loading a shapefile map.
- Iterating Shapes
Demonstrates iterating a layer of shape files.
- Load Ecw File
Demonstrates demonstrates loading an ecw file.
- Load Shapefile
Demonstrates demonstrates loading a shapefile map.
- Map Smart Palette
Demonstrates thematic mapping using smart colors.
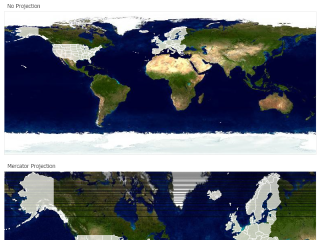
- Projections
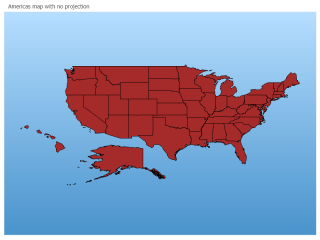
Demonstrates the different available projections for map rendering.
- Shape Grouping
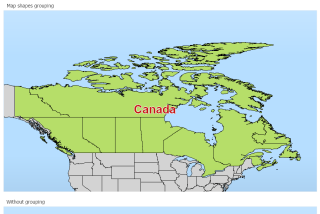
Demonstrates shape grouping functionality including the group label.
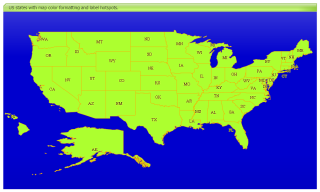
- Shape Styling
Demonstrates styling of shapefile shapes.
- Zooming
Demonstrates zooming based on latitude and longitude.
- Simple Map
Demonstrates a simple map in 3 lines of code.
- View Attributes
Demonstrates how View available attributes for a given shape file.
- Projections Image Layer
Demonstrates different projections available for map rendering along with and ecw image layer.
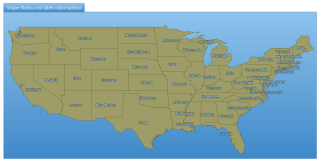
- Marker Styling
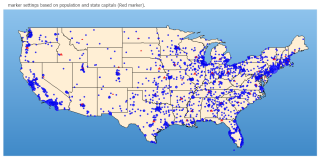
Demonstrates how to set different marker style properties based on cities' population and state capital.
- Shape With Legend
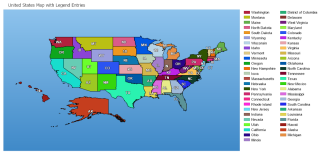
Demonstrates how to add a legend box for the shapes.
- Add Map Point
Demonstrates adding a point onto the map programmatically.
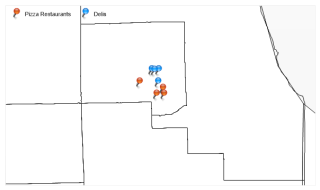
- Map Hotspots
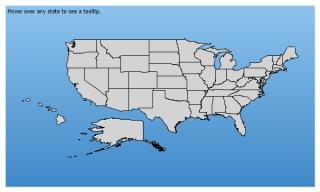
Demonstrates using hotspots to display tooltip information about map shapes.
- Map Legend
Demonstrates using a legend with maps.
- Map Legend 2
Demonstrates a variation of using a legend with maps.
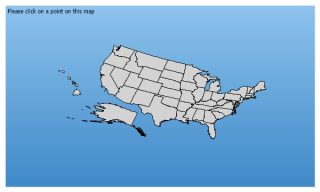
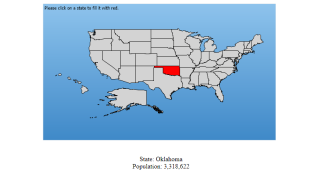
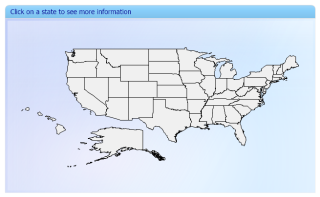
- Click Map
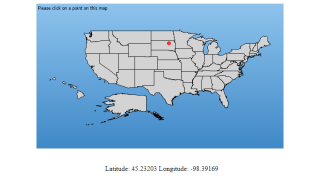
Demonstrates adding a point to the chart based on lat/long coordinates of the click.
- Click Map Projected
Demonstrates adding a point to a projected map based on lat/long coordinates of the click.
- Click Map Zoom
Demonstrates how to zoom into a map, based on a click position using lat/long coordinates..
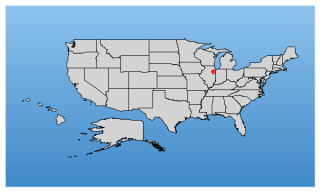
- Identify Shape
Demonstrates getting and setting the properties of a shape on a map based on a click position.
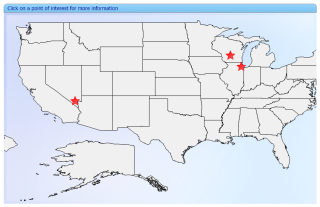
- POIMap
Demonstrates adding points of interest icons onto a map based on GPS coordinates.
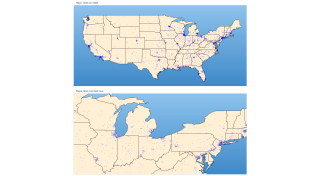
- Map Label Once
Demonstrates a map labeling feature that does not allow multiple labels a single country with multiple areas (Compare to MapLabelOptions)
- Map Label Options

Demonstrates map related labeling option.
- Map Add Line
Demonstrates manually adding lines to a map.
- Map USProjection
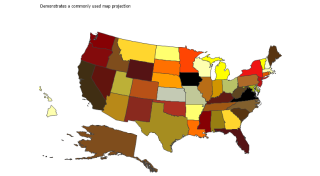
Demonstrates commonly used projections.
- Map World Palette
Demonstrates using a palette for a layer and zooming.
- Map World Regions
Demonstrates multiple shape grouping.
- Map Zoomer
Demonstrates using the AJAX zoomer with maps.
- Map Click Info
Demonstrates using hotspots and annotations with manually added map points.
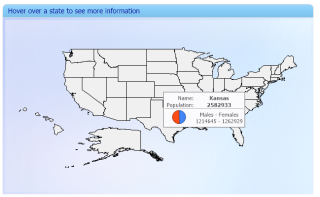
- Map Shape Info
Demonstrates adding annotations to selected shapes showing more details.
- Map Shape Rich Tooltips
Demonstrates adding rich tooltips with details and microCharts for map shapes.
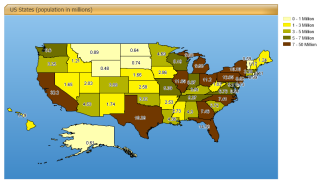
- Mapping Range Colors
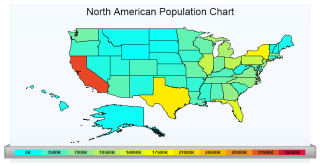
Demonstrates using range colors with maps.