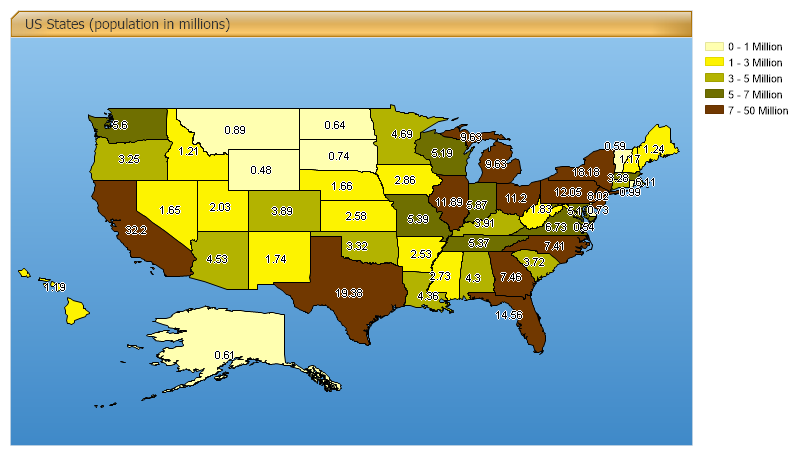
Map Smart Palette
Demonstrates thematic mapping using smart colors.
<%@ Page Language="C#" Description="dotnetCHARTING Component" %>
<%@ Register TagPrefix="dotnet" Namespace="dotnetCHARTING" Assembly="dotnetCHARTING"%>
<%@ Import Namespace="System.Drawing" %>
<%@ Import Namespace="System.Data" %>
<%@ Import Namespace="System.Data.OleDb" %>
<%@ Import Namespace="dotnetCHARTING.Mapping" %>
<html xmlns="http://www.w3.org/1999/xhtml">
<head>
<title>.netCHARTING Sample</title>
<script runat="server">
void Page_Load(Object sender,EventArgs e)
{
Chart.Type = ChartType.Map;
Chart.Size = "800x450";
Chart.Title = " US States (population in millions)";
Chart.TempDirectory = "temp";
Chart.Mapping.DefaultShape.Label.OutlineColor = Color.White;
Chart.TitleBox.Position = TitleBoxPosition.Full;
Chart.ChartArea.Background = new Background(Color.FromArgb(142,195,236),Color.FromArgb(63,137,200),90);
Chart.TitleBox.Background.Color = Color.Orange;
Chart.TitleBox.Background.GlassEffect = true;
Chart.Mapping.DefaultShape.Label.Hotspot.ToolTip = "%STATE_NAME";
Chart.Debug=true;
Chart.LegendBox.DefaultEntry.Name="<%Low/1000000> - <%High/1000000> Million";
// Demonstrates thematic mapping using the shape file data.
MapLayer layer = MapDataEngine.LoadLayer("../../images/MapFiles/primusa.shp");
Chart.LegendBox.HeaderEntry = new LegendEntry("Population","","");
Chart.LegendBox.HeaderEntry.LabelStyle.Font = new Font("Verdana",7,FontStyle.Bold);
Chart.LegendBox.HeaderEntry.SortOrder = -1;
SmartPalette sp = Chart.SmartPalette = new SmartPalette();
Color[] cols = new Color[]{Color.FromArgb(255,255,176),Color.FromArgb(253,243,0),Color.FromArgb(179,179,0),Color.FromArgb(111,111,0),Color.FromArgb(113,56,0)};
sp.Add("POPULATION",new SmartColor(cols[0], new ScaleRange(0,1000000)));
sp.Add("POPULATION",new SmartColor(cols[1], new ScaleRange(1000000,3000000)));
sp.Add("POPULATION",new SmartColor(cols[2], new ScaleRange(3000000,5000000)));
sp.Add("POPULATION",new SmartColor(cols[3], new ScaleRange(5000000,7000000)));
sp.Add("POPULATION",new SmartColor(cols[4], new ScaleRange(7000000, 50000000)));
Chart.Mapping.DefaultShape.Label.Text = "<<%POPULATION/1000000>,0.##>";
Chart.Mapping.ZoomPercentage = 115;
Chart.Mapping.ZoomCenterPoint = new PointF(36,-99);
Chart.Mapping.MapLayerCollection.Add(layer);
}
</script>
</head>
<body>
<div style="text-align:center">
<blockquote>
<dotnet:Chart id="Chart" runat="server" >
</dotnet:Chart>
</blockquote>
</div>
</body>
</html>
<%@ Page Language="vb" Description="dotnetCHARTING Component" %>
<%@ Register TagPrefix="dotnet" Namespace="dotnetCHARTING" Assembly="dotnetCHARTING"%>
<%@ Import Namespace="System.Drawing" %>
<%@ Import Namespace="System.Data" %>
<%@ Import Namespace="System.Data.OleDb" %>
<%@ Import Namespace="dotnetCHARTING.Mapping" %>
<html xmlns="http://www.w3.org/1999/xhtml">
<head>
<title>.netCHARTING Sample</title>
<script runat="server">
Sub Page_Load(ByVal sender As Object, ByVal e As EventArgs)
Chart.Type = ChartType.Map
Chart.Size = "800x450"
Chart.Title = " US States (population in millions)"
Chart.TempDirectory = "temp"
Chart.Mapping.DefaultShape.Label.OutlineColor = Color.White
Chart.TitleBox.Position = TitleBoxPosition.Full
Chart.ChartArea.Background = New Background(Color.FromArgb(142,195,236),Color.FromArgb(63,137,200),90)
Chart.TitleBox.Background.Color = Color.Orange
Chart.TitleBox.Background.GlassEffect = True
Chart.Mapping.DefaultShape.Label.Hotspot.ToolTip = "%STATE_NAME"
Chart.Debug=True
Chart.LegendBox.DefaultEntry.Name="<%Low/1000000> - <%High/1000000> Million"
' Demonstrates thematic mapping using the shape file data.
Dim layer As MapLayer = MapDataEngine.LoadLayer("../../images/MapFiles/primusa.shp")
Chart.LegendBox.HeaderEntry = New LegendEntry("Population","","")
Chart.LegendBox.HeaderEntry.LabelStyle.Font = New Font("Verdana",7,FontStyle.Bold)
Chart.LegendBox.HeaderEntry.SortOrder = -1
Dim sp As SmartPalette = New SmartPalette()
sp = Chart.SmartPalette
Dim cols As Color() = New Color(){Color.FromArgb(255,255,176),Color.FromArgb(253,243,0),Color.FromArgb(179,179,0),Color.FromArgb(111,111,0),Color.FromArgb(113,56,0)}
sp.Add("POPULATION",New SmartColor(cols(0), New ScaleRange(0,1000000)))
sp.Add("POPULATION",New SmartColor(cols(1), New ScaleRange(1000000,3000000)))
sp.Add("POPULATION",New SmartColor(cols(2), New ScaleRange(3000000,5000000)))
sp.Add("POPULATION",New SmartColor(cols(3), New ScaleRange(5000000,7000000)))
sp.Add("POPULATION",New SmartColor(cols(4), New ScaleRange(7000000, 50000000)))
Chart.Mapping.DefaultShape.Label.Text = "<<%POPULATION/1000000>,0.##>"
Chart.Mapping.ZoomPercentage = 115
Chart.Mapping.ZoomCenterPoint = New PointF(36,-99)
Chart.Mapping.MapLayerCollection.Add(layer)
End Sub
</script>
</head>
<body>
<div style="text-align:center">
<blockquote>
<dotnet:Chart id="Chart" runat="server" >
</dotnet:Chart>
</blockquote>
</div>
</body>
</html>