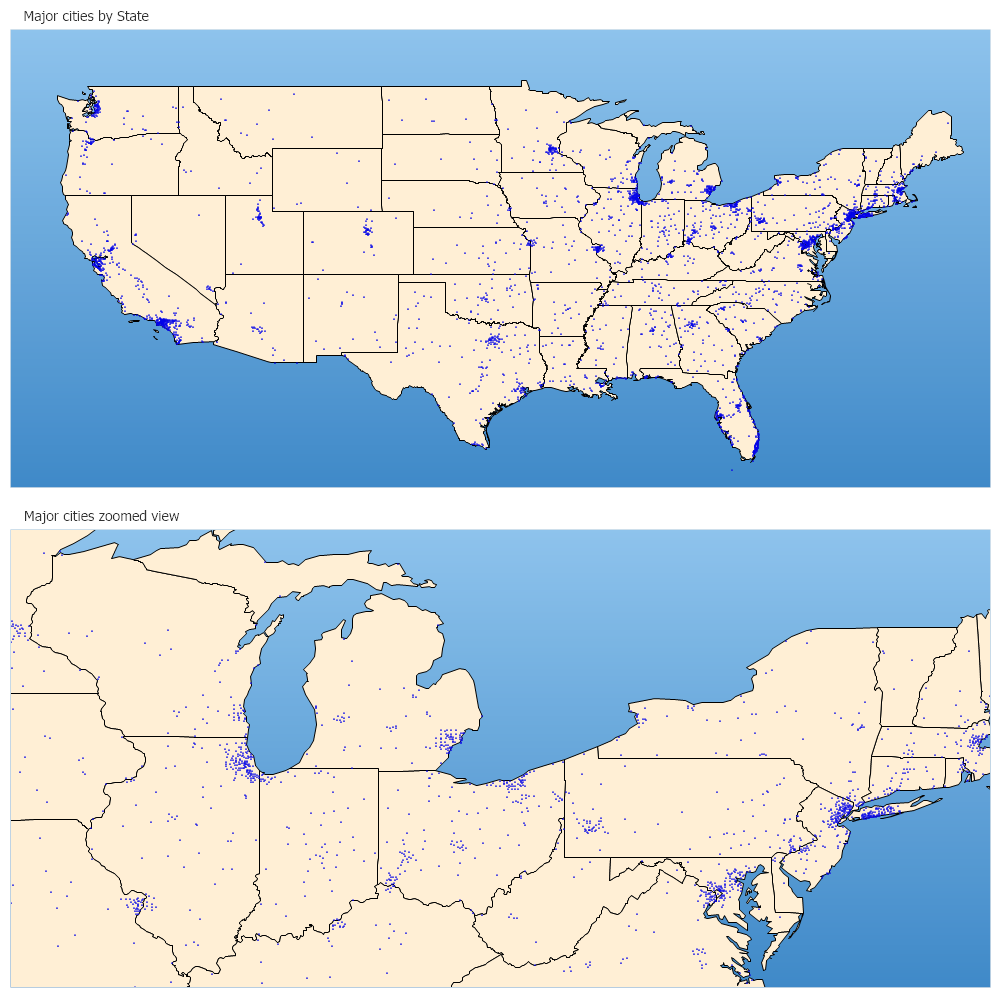
<%@ Page Language="C#" Description="dotnetCHARTING Component" %><%@ Register TagPrefix="dotnet" Namespace="dotnetCHARTING" Assembly="dotnetCHARTING"%><%@ Import Namespace="System.Drawing" %><%@ Import Namespace="dotnetCHARTING.Mapping" %><%@ Import Namespace="System.Drawing.Drawing2D" %><html xmlns="http://www.w3.org/1999/xhtml"> <head> <title>.netCHARTING Sample</title> <script runat="server">void Page_Load(Object sender,EventArgs e){ Chart.Width = 1000; Chart.Height = 500; Chart.Title = " Major cities by State"; Chart.TempDirectory = "temp"; Chart.TitleBox.Position = TitleBoxPosition.Full; Chart.ChartArea.Background = new Background(Color.FromArgb(142,195,236),Color.FromArgb(63,137,200),90); Chart.Type = ChartType.Map; Chart.Mapping.MapLayerCollection.Add("../../images/MapFiles/states.shp"); Chart.Mapping.MapLayerCollection[0].DefaultShape.Background.Color = Color.PapayaWhip; Chart.Mapping.MapLayerCollection.Add("../../images/MapFiles/cities.SHP"); Chart.Mapping.MapLayerCollection[1].DefaultShape.Marker.Type = ElementMarkerType.Circle; Chart.Mapping.MapLayerCollection[1].DefaultShape.Marker.Color = Color.Blue; Chart.Mapping.MapLayerCollection[1].DefaultShape.Marker.Size = 1; Chart.Mapping.ZoomCenterPoint = new PointF(38f,-96.5f); Chart.Mapping.ZoomPercentage = 180; //zoomed view Chart2.Width = 1000; Chart2.Height = 500; Chart2.Title = " Major cities zoomed view"; Chart2.TempDirectory = "temp"; Chart2.TitleBox.Position = TitleBoxPosition.Full; Chart2.ChartArea.Background = new Background(Color.FromArgb(142,195,236),Color.FromArgb(63,137,200),90); Chart2.Type = ChartType.Map; Chart2.Mapping.MapLayerCollection.Add("../../Images/MapFiles/states.shp"); Chart2.Mapping.MapLayerCollection[0].DefaultShape.Background.Color = Color.PapayaWhip; Chart2.Mapping.MapLayerCollection.Add("../../images/MapFiles/cities.SHP"); Chart2.Mapping.MapLayerCollection[1].DefaultShape.Marker.Type = ElementMarkerType.Circle; Chart2.Mapping.MapLayerCollection[1].DefaultShape.Marker.Color = Color.Blue; Chart2.Mapping.MapLayerCollection[1].DefaultShape.Marker.Size = 1; Chart2.Mapping.ZoomCenterPoint = new PointF(42f,-82f); Chart2.Mapping.ZoomPercentage = 500;}</script> </head> <body> <div style="text-align:center"> <dotnet:Chart id="Chart" runat="server" > </dotnet:Chart> <dotnet:Chart id="Chart2" runat="server" > </dotnet:Chart> </div> </body></html>
<%@ Page Language="vb" Description="dotnetCHARTING Component" %><%@ Register TagPrefix="dotnet" Namespace="dotnetCHARTING" Assembly="dotnetCHARTING"%><%@ Import Namespace="System.Drawing" %><%@ Import Namespace="dotnetCHARTING.Mapping" %><%@ Import Namespace="System.Drawing.Drawing2D" %><html xmlns="http://www.w3.org/1999/xhtml"> <head> <title>.netCHARTING Sample</title> <script runat="server">Sub Page_Load(ByVal sender As Object, ByVal e As EventArgs) Chart.Width = 1000 Chart.Height = 500 Chart.Title = " Major cities by State" Chart.TempDirectory = "temp" Chart.TitleBox.Position = TitleBoxPosition.Full Chart.ChartArea.Background = New Background(Color.FromArgb(142,195,236),Color.FromArgb(63,137,200),90) Chart.Type = ChartType.Map Chart.Mapping.MapLayerCollection.Add("../../images/MapFiles/states.shp") Chart.Mapping.MapLayerCollection(0).DefaultShape.Background.Color = Color.PapayaWhip Chart.Mapping.MapLayerCollection.Add("../../images/MapFiles/cities.SHP") Chart.Mapping.MapLayerCollection(1).DefaultShape.Marker.Type = ElementMarkerType.Circle Chart.Mapping.MapLayerCollection(1).DefaultShape.Marker.Color = Color.Blue Chart.Mapping.MapLayerCollection(1).DefaultShape.Marker.Size = 1 Chart.Mapping.ZoomCenterPoint = New PointF(38f,-96.5f) Chart.Mapping.ZoomPercentage = 180 'zoomed view Chart2.Width = 1000 Chart2.Height = 500 Chart2.Title = " Major cities zoomed view" Chart2.TempDirectory = "temp" Chart2.TitleBox.Position = TitleBoxPosition.Full Chart2.ChartArea.Background = New Background(Color.FromArgb(142,195,236),Color.FromArgb(63,137,200),90) Chart2.Type = ChartType.Map Chart2.Mapping.MapLayerCollection.Add("../../Images/MapFiles/states.shp") Chart2.Mapping.MapLayerCollection(0).DefaultShape.Background.Color = Color.PapayaWhip Chart2.Mapping.MapLayerCollection.Add("../../images/MapFiles/cities.SHP") Chart2.Mapping.MapLayerCollection(1).DefaultShape.Marker.Type = ElementMarkerType.Circle Chart2.Mapping.MapLayerCollection(1).DefaultShape.Marker.Color = Color.Blue Chart2.Mapping.MapLayerCollection(1).DefaultShape.Marker.Size = 1 Chart2.Mapping.ZoomCenterPoint = New PointF(42f,-82f) Chart2.Mapping.ZoomPercentage = 500End Sub</script> </head> <body> <div style="text-align:center"> <dotnet:Chart id="Chart" runat="server" > </dotnet:Chart> <dotnet:Chart id="Chart2" runat="server" > </dotnet:Chart> </div> </body></html>