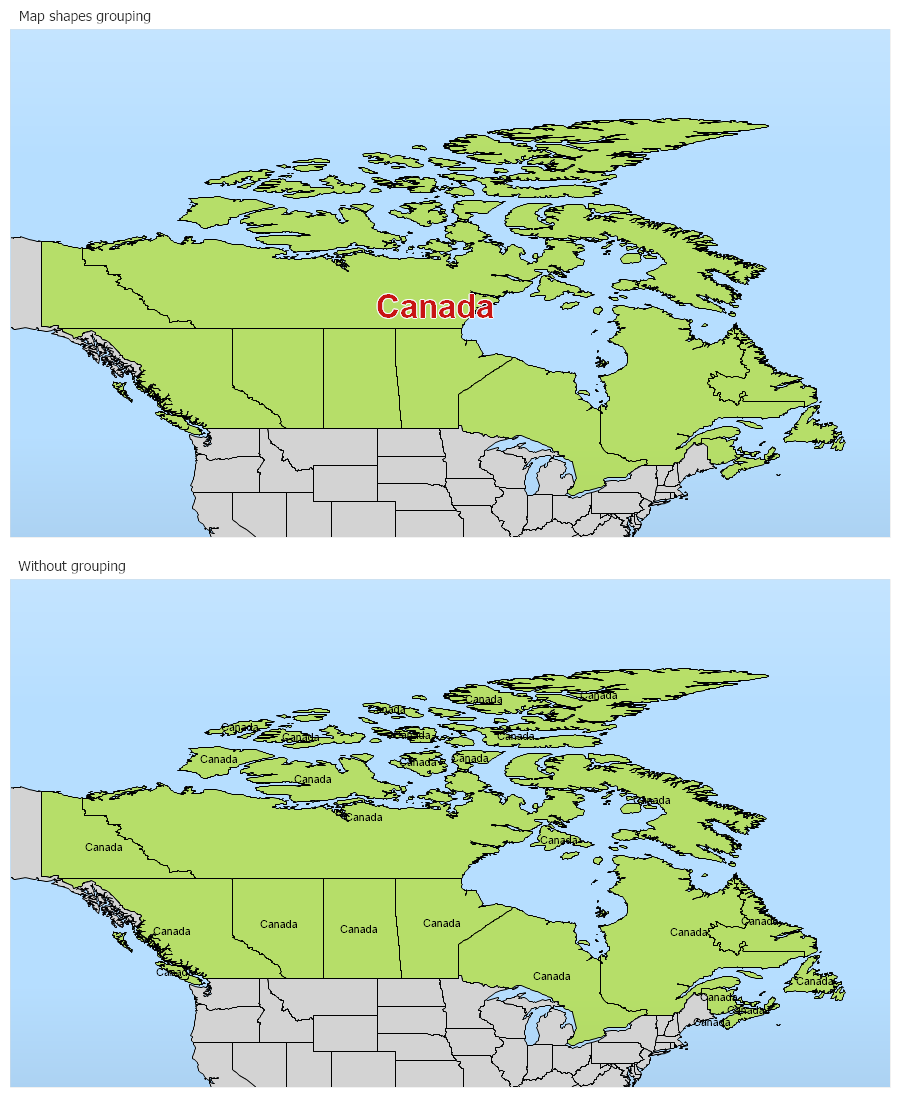
Shape Grouping
Demonstrates shape grouping functionality including the group label.
<%@ Page Language="C#" Description="dotnetCHARTING Component" %>
<%@ Register TagPrefix="dotnet" Namespace="dotnetCHARTING" Assembly="dotnetCHARTING"%>
<%@ Import Namespace="System.Drawing" %>
<%@ Import Namespace="System.Drawing.Drawing2D" %>
<%@ Import Namespace="dotnetCHARTING.Mapping" %>
<html xmlns="http://www.w3.org/1999/xhtml">
<head>
<title>.netCHARTING Sample</title>
<script runat="server">
void Page_Load(Object sender,EventArgs e)
{
Chart.Type = ChartType.Map;
Chart.Size = "900x550";
Chart.Title = "Map shapes grouping";
Chart.TempDirectory = "temp";
Chart.ChartArea.Background.Color = Color.FromArgb(182,222,255);
// Demonstrates how to group multiple shapes together and apply a single label to them.
MapLayer layer = MapDataEngine.LoadLayer( "../../images/MapFiles/canada.shp");
Chart.Mapping.MapLayerCollection.Add(layer);
dotnetCHARTING.Mapping.Group gr = new dotnetCHARTING.Mapping.Group("CNTRY_NAME", "Canada");
gr.Label = new dotnetCHARTING.Label("Canada",new Font("Arial",25,FontStyle.Bold),Color.FromArgb(200,20,20),Color.White);
layer.Groups.Add(gr);
layer.DefaultShape.Background.Color = Color.FromArgb(150,182,222,0);
Chart.Mapping.DefaultShape.Line.Color = Color.Black;
Chart.Mapping.ZoomPercentage = 130;
Chart.Mapping.ZoomCenterPoint = new PointF(65,-96);
Chart.Mapping.MapLayerCollection.Add( "../../images/MapFiles/states.shp");
Chart.Mapping.MapLayerCollection[1].DefaultShape.Background.Color = Color.LightGray;
//--------------------------------------------------------
Chart2.Type = ChartType.Map;
Chart2.Size = "900x550";
Chart2.Title = "Without grouping";
Chart2.TempDirectory = "temp";
Chart2.ChartArea.Background.Color = Color.FromArgb(182,222,255);
// Demonstrates how to group multiple shapes together and apply a single label to them.
Chart2.Mapping.DefaultShape.Background.Color = Color.FromArgb(150,182,222,0);
layer = MapDataEngine.LoadLayer( "../../images/MapFiles/canada.shp");
layer.DefaultShape.Label.Text = "%CNTRY_NAME";
Chart2.Mapping.MapLayerCollection.Add(layer);
Chart2.Mapping.DefaultShape.Line.Color = Color.Black;
Chart2.Mapping.ZoomPercentage = 130;
Chart2.Mapping.ZoomCenterPoint = new PointF(65,-96);
Chart2.Mapping.MapLayerCollection.Add( "../../images/MapFiles/states.shp");
Chart2.Mapping.MapLayerCollection[1].DefaultShape.Background.Color = Color.LightGray;
}
</script>
</head>
<body>
<div style="text-align:center">
<dotnet:Chart id="Chart" runat="server" >
</dotnet:Chart>
</div>
<div style="text-align:center">
<dotnet:Chart id="Chart2" runat="server" >
</dotnet:Chart>
</div>
</body>
</html>
<%@ Page Language="vb" Description="dotnetCHARTING Component" %>
<%@ Register TagPrefix="dotnet" Namespace="dotnetCHARTING" Assembly="dotnetCHARTING"%>
<%@ Import Namespace="System.Drawing" %>
<%@ Import Namespace="System.Drawing.Drawing2D" %>
<%@ Import Namespace="dotnetCHARTING.Mapping" %>
<html xmlns="http://www.w3.org/1999/xhtml">
<head>
<title>.netCHARTING Sample</title>
<script runat="server">
Sub Page_Load(ByVal sender As Object, ByVal e As EventArgs)
Chart.Type = ChartType.Map
Chart.Size = "900x550"
Chart.Title = "Map shapes grouping"
Chart.TempDirectory = "temp"
Chart.ChartArea.Background.Color = Color.FromArgb(182,222,255)
' Demonstrates how to group multiple shapes together and apply a single label to them.
Dim layer As MapLayer = MapDataEngine.LoadLayer("../../images/MapFiles/canada.shp")
Chart.Mapping.MapLayerCollection.Add(layer)
Dim gr As dotnetCHARTING.Mapping.Group = New dotnetCHARTING.Mapping.Group("CNTRY_NAME", "Canada")
gr.Label = New dotnetCHARTING.Label("Canada",New Font("Arial",25,FontStyle.Bold),Color.FromArgb(200,20,20),Color.White)
layer.Groups.Add(gr)
layer.DefaultShape.Background.Color = Color.FromArgb(150,182,222,0)
Chart.Mapping.DefaultShape.Line.Color = Color.Black
Chart.Mapping.ZoomPercentage = 130
Chart.Mapping.ZoomCenterPoint = New PointF(65,-96)
Chart.Mapping.MapLayerCollection.Add("../../images/MapFiles/states.shp")
Chart.Mapping.MapLayerCollection(1).DefaultShape.Background.Color = Color.LightGray
'--------------------------------------------------------
Chart2.Type = ChartType.Map
Chart2.Size = "900x550"
Chart2.Title = "Without grouping"
Chart2.TempDirectory = "temp"
Chart2.ChartArea.Background.Color = Color.FromArgb(182,222,255)
' Demonstrates how to group multiple shapes together and apply a single label to them.
Chart2.Mapping.DefaultShape.Background.Color = Color.FromArgb(150,182,222,0)
layer = MapDataEngine.LoadLayer("../../images/MapFiles/canada.shp")
layer.DefaultShape.Label.Text = "%CNTRY_NAME"
Chart2.Mapping.MapLayerCollection.Add(layer)
Chart2.Mapping.DefaultShape.Line.Color = Color.Black
Chart2.Mapping.ZoomPercentage = 130
Chart2.Mapping.ZoomCenterPoint = New PointF(65,-96)
Chart2.Mapping.MapLayerCollection.Add("../../images/MapFiles/states.shp")
Chart2.Mapping.MapLayerCollection(1).DefaultShape.Background.Color = Color.LightGray
End Sub
</script>
</head>
<body>
<div style="text-align:center">
<dotnet:Chart id="Chart" runat="server" >
</dotnet:Chart>
</div>
<div style="text-align:center">
<dotnet:Chart id="Chart2" runat="server" >
</dotnet:Chart>
</div>
</body>
</html>