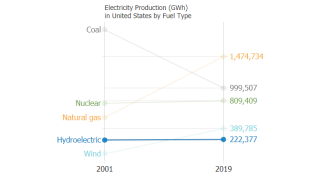
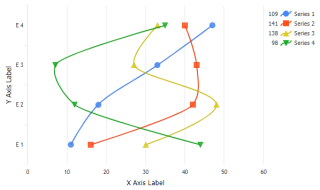
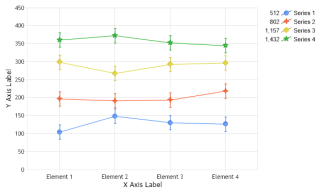
- JS Slope YAxis Categories
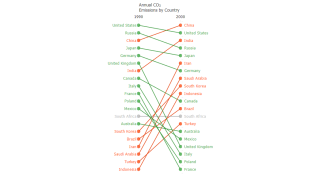
This sample deomonstrates a ranked slope chart with specific categories for each axis.
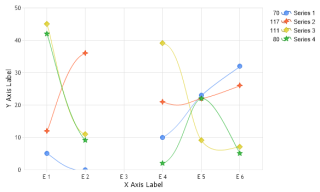
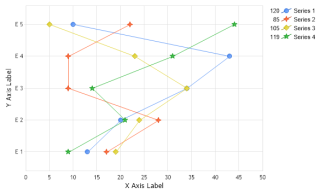
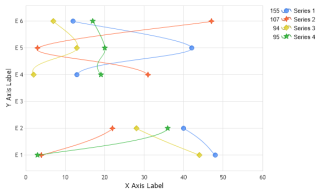
- JS Dumbbell Multi Axes
Demonstrates a dumbbell slider chart with multiple axes. Uses firstPoint and lastPoint to manage styling.
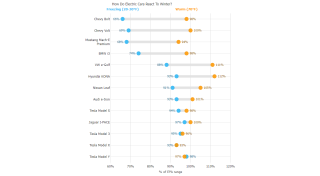
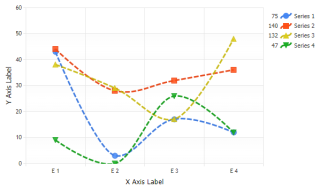
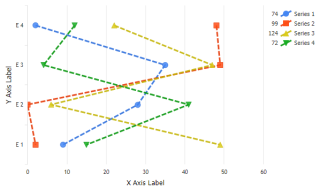
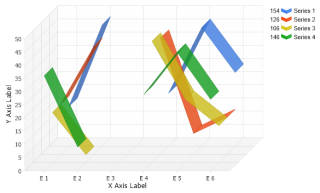
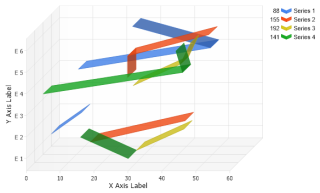
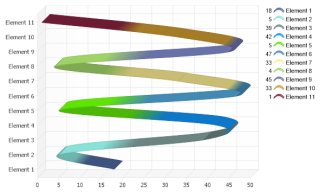
- JS Dumbbell Styled Line Segments
Demonstrates a dumbbell slider chart with styled lines that encompass element markers. Uses firstPoint and lastPoint to manage styling.
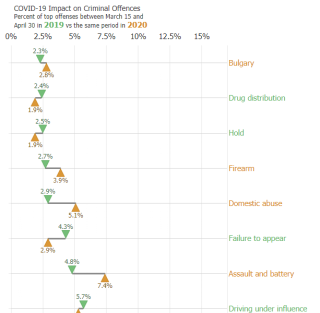
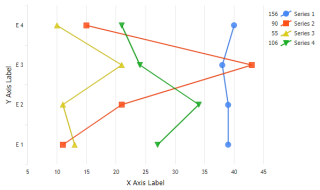
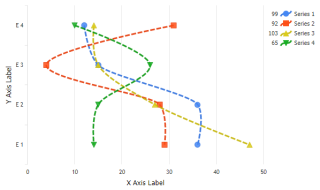
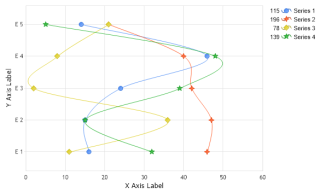
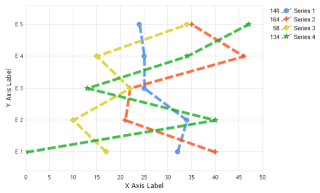
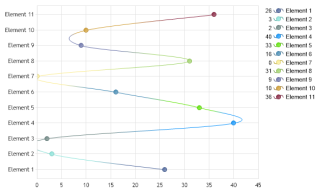
- JS Dumbbell Vertical
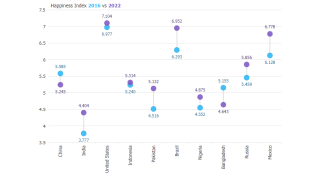
Demonstrates a vertical dumbbell slider chart. Uses firstPoint and lastPoint to manage styling.
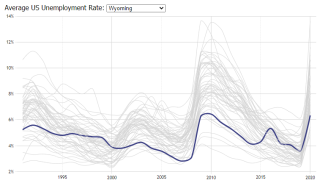
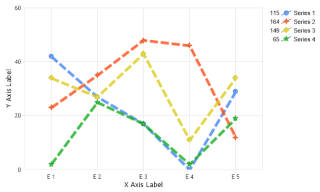
- JS Average Rate
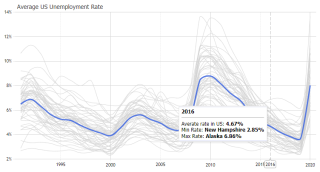
This sample deomonstrates a computed line series with muted source lines for context.
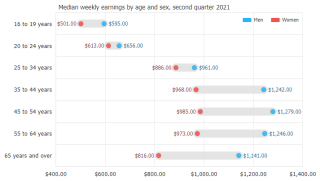
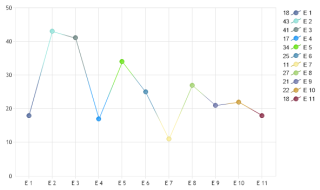
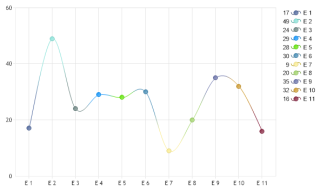
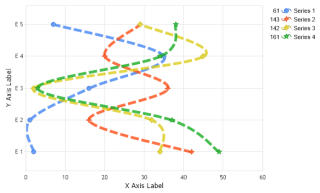
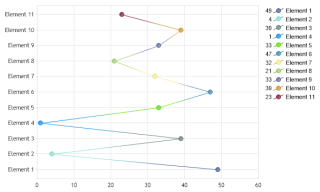
- JS Dumbbell Markers
Demonstrates a dumbbell slider chart with offset markers to compare data between two years. Uses firstPoint and lastPoint to manage styling.
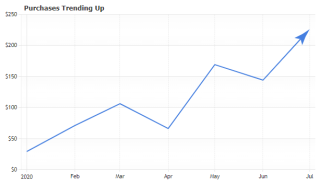
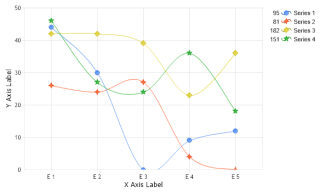
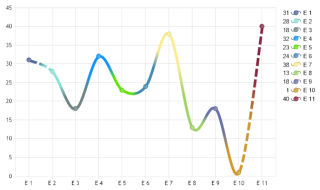
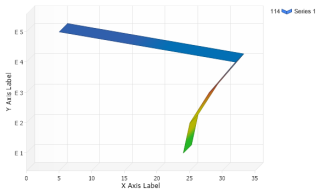
- JS Linear Trendline
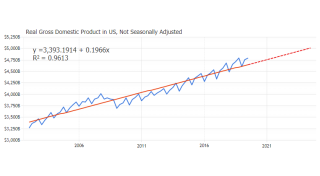
Demonstrates how to create a Linear trendline calculation with prediction.
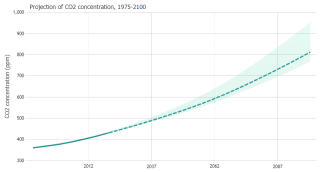
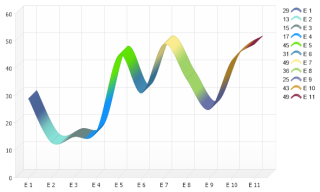
- JS Uncertainty Fan Chart
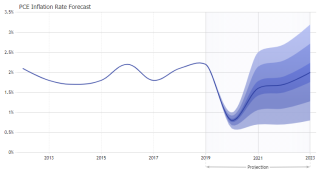
Demonstrates how to draw an uncertainty fan chart.
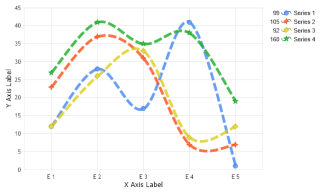
- JS Uncertainty Line Chart
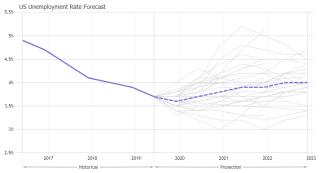
This sample deomonstrates a line projection making up the average of many projection lines.
- JS Uncertainty Range Chart
This sample deomonstrates an uncertainty line projection chart.
- JS Running Average
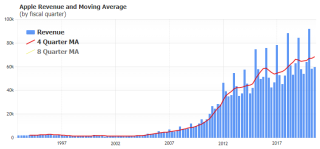
Calculate running averages over columns.
- JS Segment Selection
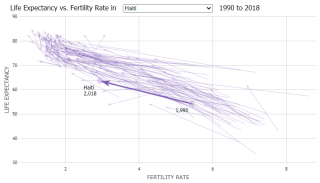
This sample deomonstrates muted vector segments that appear on hover or when selected with a drop down.
- JS Series Selection Sync
This sample uses series selection to highlight line series in sync with a dropdown control.
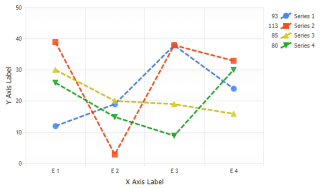
- JS Slope Chart
This sample deomonstrates a slope chart with point axis ticks axis tick.
- JS Companies Revenue

Demonstrates multiple line charts with muted series.
- JS Line Type Caps
Demonstrates Line chart with arrow caps.
- JS Customer Satisfaction Chart
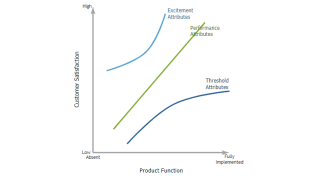
Demonstrates a line chart used to illustrate a concept.
- JS Spline Tension
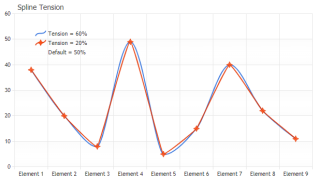
Specifying spline tension.
- JS IPhone Prices
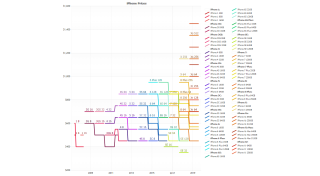
Demonstrates line chart of phone prices and how to draw faux stepped line series.
- JS Line
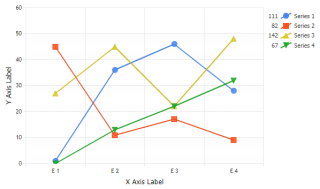
Demonstrates a line chart.
- JS Spline
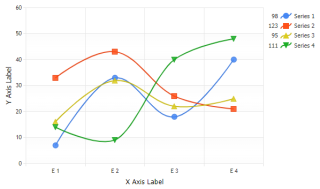
Demonstrates a spline chart.
- JS Line Dashed
Demonstrates a dash style line chart.
- JS Spline Dashed
Demonstrates a dash style spline chart.
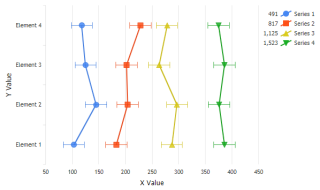
- JS Error Line
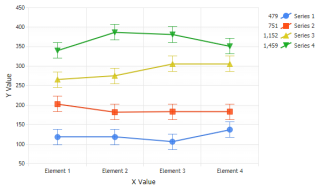
Demonstrates error bars on chart lines.
- JS Horiz Line
Demonstrates a line chart.
- JS Horiz Spline
Demonstrates a spline chart.
- JS Horiz Line Dashed
Demonstrates a dash style line chart.
- JS Horiz Spline Dashed
Demonstrates a dash style spline chart.
- JS Horiz Error Line
Demonstrates error bars on lines in a horizontal chart.
- Line
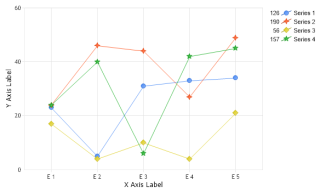
Lines in 2D.
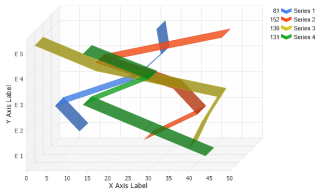
- Line 3D
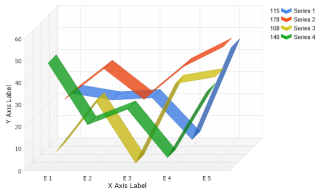
Lines in 3D.
- Spline 3D
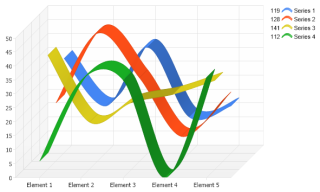
Spline in 3D.
- Line MColor 3D
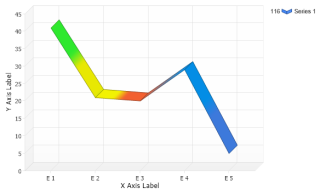
Multi color line in 3D.
- Line MColor
Multi color line in 2D.
- Spline MColor 3D
Multi color spline in 3D.
- Spline MColor
Multi color spline in 2D.
- Spline
Splines in 2D.
- SplineEmptyE
Splines with empty elements in 2D.
- LineEmptyE3D
Lines with empty elements in 3D.
- Thick Lines Dashed
Thick lines with a dash style in 2D.
- Spline Dashed
Thick splines with a dash style in 2D.
- Spline MColor Dashed
Multi color, thick, dashed spline in 2D.
- Line Horiz
Lines in 2D.
- Line Horiz 3D
Lines in 3D.
- Spline Horiz
Splines in 2D.
- SplineHorizEmptyE
Splines with empty elements in 2D.
- LineHorizEmptyE3D
Lines with empty elements in 3D.
- Thick Lines Horiz Dashed
Thick lines with a dash style in 2D.
- Spline Horiz Dashed
Thick splines with a dash style in 2D.
- Line Horiz MColor 3D
Multi color line in 3D.
- Line Horiz MColor
Multi color line in 2D.
- Spline Horiz MColor 3D
Multi color spline in 3D.
- Spline Horiz MColor
Multi color spline in 2D.
- Error Line
Lines with error bars.
- Time Axis Automation
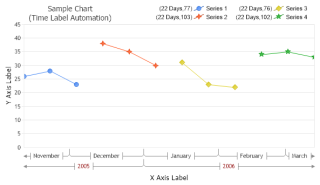
Time Axis Label Automation.
- ZoomedCAX
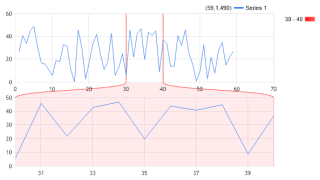
Zoomed Chart Area on the X axis.
- ZoomedCAY
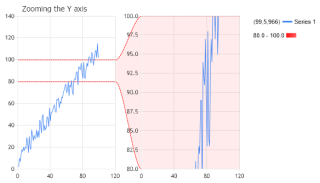
Zoomed Chart Area on the X axis.