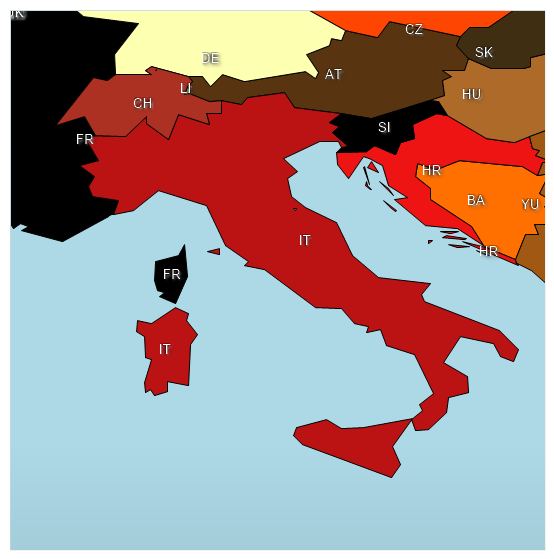
<%@ Page Language="C#" Description="dotnetCHARTING Component" %><%@ Register TagPrefix="dotnet" Namespace="dotnetCHARTING" Assembly="dotnetCHARTING"%><%@ Import Namespace="System.Drawing" %><%@ Import Namespace="System.Drawing.Drawing2D" %><%@ Import Namespace="dotnetCHARTING.Mapping" %><html xmlns="http://www.w3.org/1999/xhtml"> <head> <title>.netCHARTING Sample</title> <script runat="server"> // Demonstrates map related labeling option. void Page_Load(Object sender,EventArgs e) { Chart.Type = ChartType.Map; Chart.Size = "550x550"; //Chart.Title = "Chart Sample"; Chart.TempDirectory = "temp"; Chart.Debug=true; Chart.TitleBox.Position = TitleBoxPosition.Full; Chart.LegendBox.Visible = false; Chart.ChartArea.Background.Color = Color.LightBlue; Chart.Mapping.ZoomPercentage = 434; Chart.Mapping.ZoomCenterPoint = new PointF(42, 12); MapLayer layer = MapDataEngine.LoadLayer("../../images/MapFiles/europe.shp"); Chart.Mapping.DefaultShape.Label.Font = new Font("Arial", 10); Chart.Mapping.DefaultShape.Label.Text = "%Code"; Chart.Mapping.DefaultShape.Label.GlowColor = Color.Black; Chart.Mapping.DefaultShape.Label.Color = Color.White; Chart.Mapping.DefaultShape.Label.Hotspot.ToolTip = "%Cntry_Name"; Chart.Mapping.DefaultShape.Label.Shadow.Color = Color.White; Chart.Mapping.DefaultShape.Label.Shadow.Depth = 2; layer.PaletteName = Palette.Autumn; Chart.Mapping.MapLayerCollection.Add(layer); } </script> </head> <body> <div style="text-align:center"> <dotnet:Chart id="Chart" runat="server" > </dotnet:Chart> </div> </body></html>
<%@ Page Language="vb" Description="dotnetCHARTING Component" %><%@ Register TagPrefix="dotnet" Namespace="dotnetCHARTING" Assembly="dotnetCHARTING"%><%@ Import Namespace="System.Drawing" %><%@ Import Namespace="System.Drawing.Drawing2D" %><%@ Import Namespace="dotnetCHARTING.Mapping" %><html xmlns="http://www.w3.org/1999/xhtml"> <head> <title>.netCHARTING Sample</title> <script runat="server"> ' Demonstrates map related labeling option. Sub Page_Load(ByVal sender As Object, ByVal e As EventArgs) Chart.Type = ChartType.Map Chart.Size = "550x550" 'Chart.Title = "Chart Sample"; Chart.TempDirectory = "temp" Chart.Debug=True Chart.TitleBox.Position = TitleBoxPosition.Full Chart.LegendBox.Visible = False Chart.ChartArea.Background.Color = Color.LightBlue Chart.Mapping.ZoomPercentage = 434 Chart.Mapping.ZoomCenterPoint = New PointF(42, 12) Dim layer As MapLayer = MapDataEngine.LoadLayer("../../images/MapFiles/europe.shp") Chart.Mapping.DefaultShape.Label.Font = New Font("Arial", 10) Chart.Mapping.DefaultShape.Label.Text = "%Code" Chart.Mapping.DefaultShape.Label.GlowColor = Color.Black Chart.Mapping.DefaultShape.Label.Color = Color.White Chart.Mapping.DefaultShape.Label.Hotspot.ToolTip = "%Cntry_Name" Chart.Mapping.DefaultShape.Label.Shadow.Color = Color.White Chart.Mapping.DefaultShape.Label.Shadow.Depth = 2 layer.PaletteName = Palette.Autumn Chart.Mapping.MapLayerCollection.Add(layer) End Sub </script> </head> <body> <div style="text-align:center"> <dotnet:Chart id="Chart" runat="server" > </dotnet:Chart> </div> </body></html>