//Set different colors to each state Chart.PaletteName = Palette.Three; int i=0; foreach(Shape shape in layer.Shapes) { if(i >= Chart.Palette.Length ) i=0; shape.Background.Color = Chart.Palette[i]; i++; } }
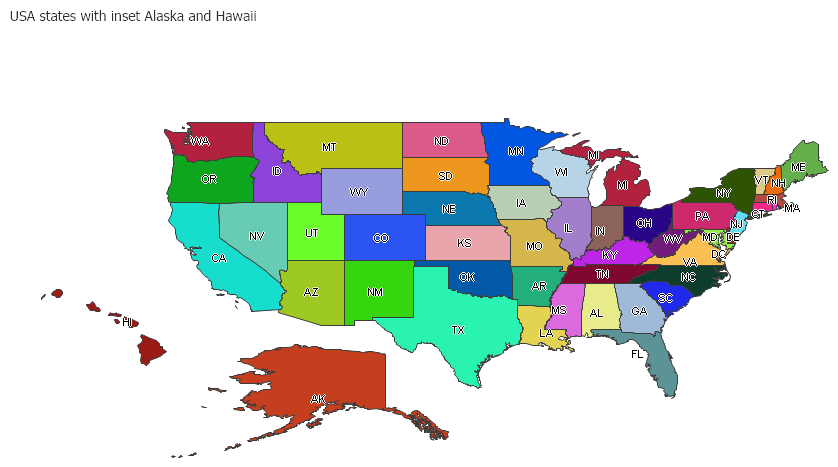
<%@ Page Language="vb" Description="dotnetCHARTING Component" %> <%@ Register TagPrefix="dotnet" Namespace="dotnetCHARTING" Assembly="dotnetCHARTING"%> <%@ Import Namespace="System.Drawing" %> <%@ Import Namespace="System.Drawing.Drawing2D" %> <%@ Import Namespace="dotnetCHARTING.Mapping" %> <html xmlns="http://www.w3.org/1999/xhtml"> <head> <title>.netCHARTING Sample</title> <script runat="server"> ' Demonstrates how to iterate a layer of shape files. Sub Page_Load(ByVal sender As Object, ByVal e As EventArgs) Chart.Type = ChartType.Map Chart.Size = "900x550" Chart.Title = " USA states with inset Alaska and Hawaii" Chart.TempDirectory = "temp" Chart.Debug=True Chart.ChartArea.Line.Color = Color.Transparent Dim layer As MapLayer = MapDataEngine.LoadLayer("../../../Images/MapFiles/primusa.shp") Chart.Mapping.DefaultShape.Label.Text = "%State_Abbr" Chart.Mapping.DefaultShape.Label.OutlineColor = Color.White Chart.Mapping.DefaultShape.Label.Hotspot.ToolTip = "%State_NAME"
Chart.Mapping.MapLayerCollection.Add(layer)
'Set different colors to each state Chart.PaletteName = Palette.Three Dim i As Integer=0 For Each shape As Shape In layer.Shapes If i >= Chart.Palette.Length Then i=0 End If shape.Background.Color = Chart.Palette(i) i += 1 Next shape End Sub