Gallery
<%@ Page Language="C#" Description="dotnetCHARTING Component" %>
<%@ Register TagPrefix="dotnet" Namespace="dotnetCHARTING" Assembly="dotnetCHARTING"%>
<%@ Import Namespace="System.Drawing" %>
<%@ Import Namespace="System.Drawing.Drawing2D" %>
<%@ Import Namespace="dotnetCHARTING.Mapping" %>
<html xmlns="http://www.w3.org/1999/xhtml">
<head>
<title>.netCHARTING Sample</title>
<script runat="server">
// Demonstrates how to iterate a layer of shape files.
void Page_Load(Object sender,EventArgs e)
{
Chart.Type = ChartType.Map;
Chart.Size = "1000x850";
Chart.TempDirectory = "temp";
Chart.Debug=true;
Chart.TitleBox.Label.Text=" ";
Chart.TitleBox.Position = TitleBoxPosition.FullWithLegend;
Chart.ChartArea.Label.Text="Europe";
Chart.ChartArea.Label.Font = new Font("Arial", 14);
Chart.ChartArea.Background=new Background(Color.FromArgb(142,195,236),Color.FromArgb(63,137,200),90);
MapLayer layer = MapDataEngine.LoadLayer("../../../Images/MapFiles/europe.shp");
Chart.Mapping.DefaultShape.Label.Text = "%Code";
Chart.Mapping.DefaultShape.Label.OutlineColor = Color.White;
Chart.Mapping.DefaultShape.Label.Hotspot.ToolTip = "%Cntry_Name";
Chart.Mapping.ZoomPercentage = 110;
Chart.Mapping.ZoomCenterPoint = new PointF(52,4);
Chart.Mapping.MapLayerCollection.Add(layer);
//Set different colors to each state
Chart.PaletteName = Palette.Four;
int i=0;
foreach(Shape shape in layer.Shapes)
{
if(i >= Chart.Palette.Length )
{
i=0;
Chart.PaletteName = Palette.Three;
}
shape.Background.Color = Chart.Palette[i];
Chart.ChartArea.LegendBox.ExtraEntries.Add(new LegendEntry((string)shape["CNTRY_NAME"],"",Chart.Palette[i]));
i++;
}
}
</script>
</head>
<body>
<div style="text-align:center">
<dotnet:Chart id="Chart" runat="server" >
</dotnet:Chart>
</div>
</body>
</html>
<%@ Page Language="vb" Description="dotnetCHARTING Component" %>
<%@ Register TagPrefix="dotnet" Namespace="dotnetCHARTING" Assembly="dotnetCHARTING"%>
<%@ Import Namespace="System.Drawing" %>
<%@ Import Namespace="System.Drawing.Drawing2D" %>
<%@ Import Namespace="dotnetCHARTING.Mapping" %>
<html xmlns="http://www.w3.org/1999/xhtml">
<head>
<title>.netCHARTING Sample</title>
<script runat="server">
' Demonstrates how to iterate a layer of shape files.
Sub Page_Load(ByVal sender As Object, ByVal e As EventArgs)
Chart.Type = ChartType.Map
Chart.Size = "1000x850"
Chart.TempDirectory = "temp"
Chart.Debug=True
Chart.TitleBox.Label.Text=" "
Chart.TitleBox.Position = TitleBoxPosition.FullWithLegend
Chart.ChartArea.Label.Text="Europe"
Chart.ChartArea.Label.Font = New Font("Arial", 14)
Chart.ChartArea.Background = New Background(Color.FromArgb(142,195,236),Color.FromArgb(63,137,200),90)
Dim layer As MapLayer = MapDataEngine.LoadLayer("../../../Images/MapFiles/europe.shp")
Chart.Mapping.DefaultShape.Label.Text = "%Code"
Chart.Mapping.DefaultShape.Label.OutlineColor = Color.White
Chart.Mapping.DefaultShape.Label.Hotspot.ToolTip = "%Cntry_Name"
Chart.Mapping.ZoomPercentage = 110
Chart.Mapping.ZoomCenterPoint = New PointF(52,4)
Chart.Mapping.MapLayerCollection.Add(layer)
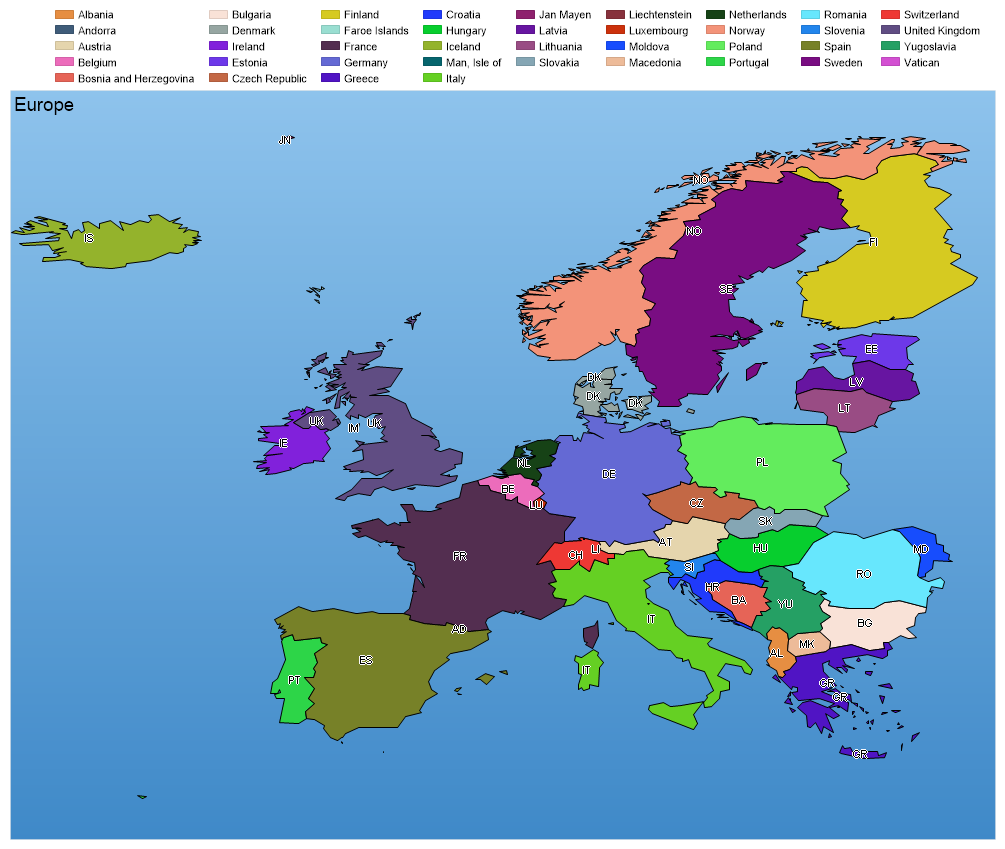
'Set different colors to each state
Chart.PaletteName = Palette.Four
Dim i As Integer=0
For Each shape As Shape In layer.Shapes
If i >= Chart.Palette.Length Then
i=0
Chart.PaletteName = Palette.Three
End If
shape.Background.Color = Chart.Palette(i)
Chart.ChartArea.LegendBox.ExtraEntries.Add(New LegendEntry(CStr(shape("CNTRY_NAME")),"",Chart.Palette(i)))
i += 1
Next shape
End Sub
</script>
</head>
<body>
<div style="text-align:center">
<dotnet:Chart id="Chart" runat="server" >
</dotnet:Chart>
</div>
</body>
</html>
- Sample FilenameGallery/j04.aspx
- Version4.0
- Uses DatabaseNo