Gallery
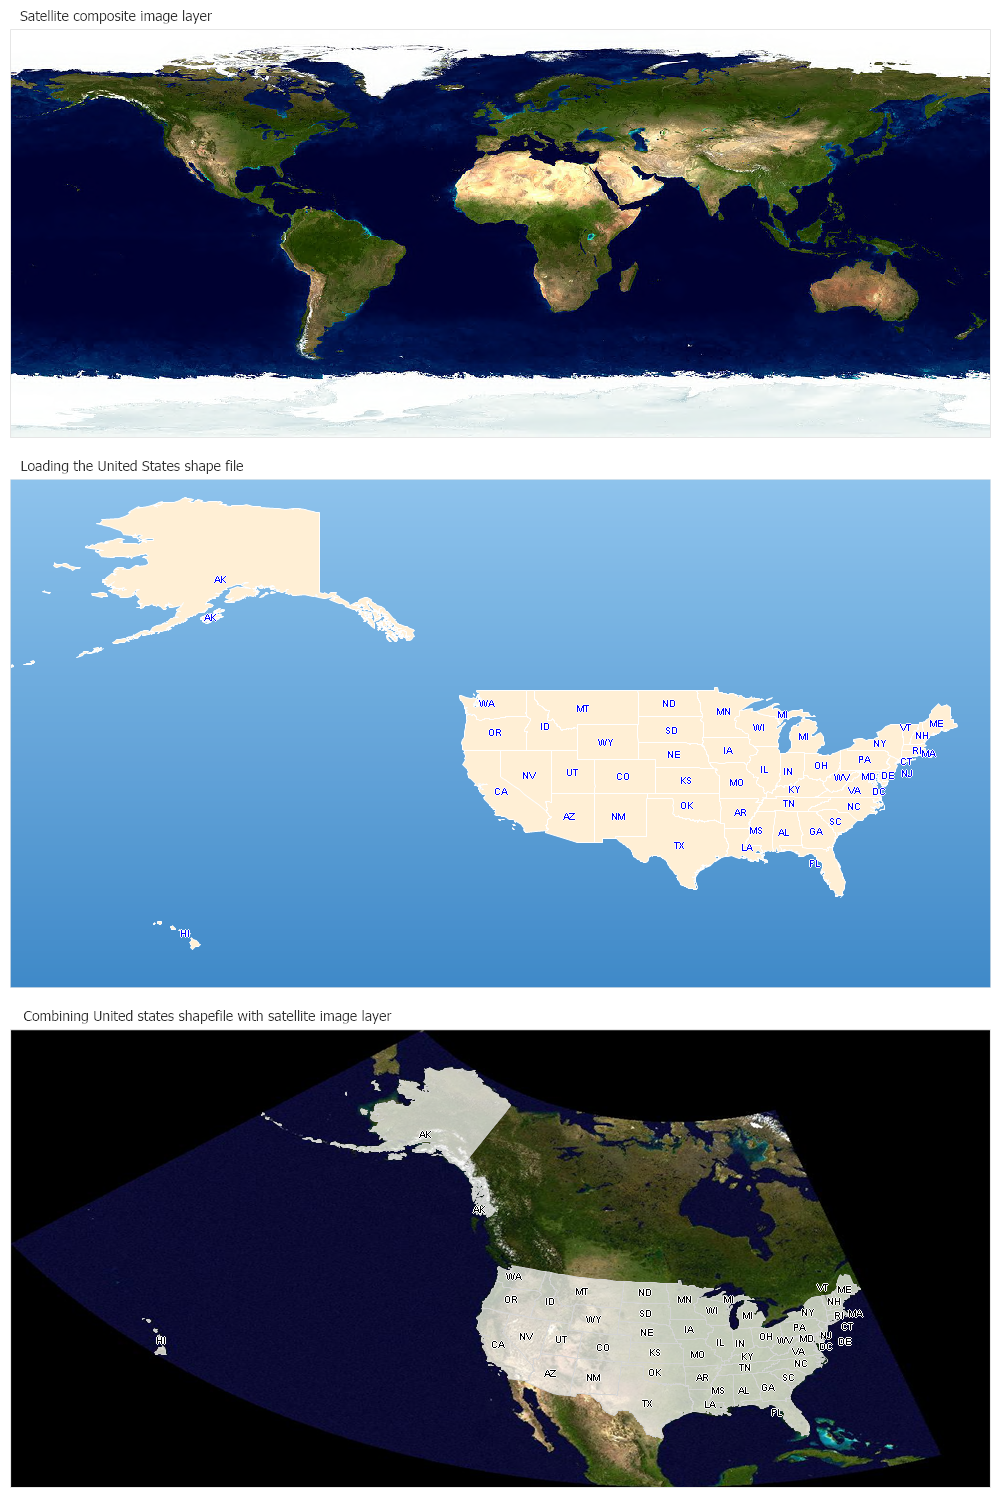
<%@ Page Language="C#" Description="dotnetCHARTING Component" %>
<%@ Register TagPrefix="dotnet" Namespace="dotnetCHARTING" Assembly="dotnetCHARTING"%>
<%@ Import Namespace="System.Drawing" %>
<%@ Import Namespace="System.Drawing.Drawing2D" %>
<%@ Import Namespace="dotnetCHARTING.Mapping" %>
<html xmlns="http://www.w3.org/1999/xhtml">
<head>
<title>.netCHARTING Sample</title>
<script runat="server">
// Demonstrates how to load an ecw file in combination with a shape file.
void Page_Load(Object sender,EventArgs e)
{
// This sample uses a pre-generated image. To run the sample live,
// please uncomment the code below,
// download ecw.zip form https://dotnetcharting.com/ecw.zip and copy the ecw dlls in your application's bin directoy.
/*dotnetCHARTING.Chart worldChart = new dotnetCHARTING.Chart();
worldChart.Type = ChartType.Map;
worldChart.Size = "1000x450";
worldChart.Title = "Satellite composite image layer";
worldChart.TempDirectory = "temp";
MapLayer layer = MapDataEngine.LoadLayer( "../../images/MapFiles/worldmap.ecw");
worldChart.Mapping.MapLayerCollection.Add(layer);
Controls.Add(worldChart);*/
Chart2.Type = ChartType.Map;
Chart2.Size = "1000x550";
Chart2.Title = "Loading the United States shape file";
Chart2.TempDirectory = "temp";
Chart2.ChartArea.Background = new Background(Color.FromArgb(142,195,236),Color.FromArgb(63,137,200),90);
Chart2.Mapping.ZoomPercentage = 98;
Chart2.Mapping.ZoomCenterPoint = new PointF(44,-120);
MapLayer layerStates2 = MapDataEngine.LoadLayer("../../images/MapFiles/states.shp");
layerStates2.DefaultShape.Label.Text = "%STATE_ABBR";
layerStates2.DefaultShape.Label.Color = Color.Blue;
layerStates2.DefaultShape.Label.OutlineColor = Color.White;
layerStates2.DefaultShape.Label.Font = new Font("Arial", 7);
layerStates2.DefaultShape.Background.Color = Color.PapayaWhip;
layerStates2.DefaultShape.Line.Color = Color.White;
Chart2.Mapping.MapLayerCollection.Add(layerStates2);
Chart3.Type = ChartType.Map;
Chart3.Size = "1000x500";
Chart3.Title = "Combining United states shapefile with satellite image layer";
Chart3.TempDirectory = "temp";
MapLayer layerJpg = MapDataEngine.LoadLayer( "","../../images/MapFiles/NorthAmerica.jpg");
Chart3.Mapping.MapLayerCollection.Add(layerJpg);
Chart3.Mapping.Projection.Type = ProjectionType.LambertConic;
Chart3.Mapping.Projection.Parameters = "-96, 40, 32, 50";
Chart3.Mapping.DefaultShape.Line.Color = Color.LightGray;
MapLayer layerStates3 = MapDataEngine.LoadLayer("../../images/MapFiles/states.shp");
layerStates3.DefaultShape.Label.Text = "%STATE_ABBR";
layerStates3.DefaultShape.Label.Color = Color.Black;
layerStates3.DefaultShape.Label.OutlineColor = Color.White;
layerStates3.DefaultShape.Label.Font = new Font("Arial", 7);
Chart3.Mapping.MapLayerCollection.Add(layerStates3);
}
</script>
</head>
<body>
<div style="text-align:center">
<img alt="World Map" src="temp/worldmap.png"/>
<dotnet:Chart id="Chart2" runat="server" >
</dotnet:Chart>
<dotnet:Chart id="Chart3" runat="server" >
</dotnet:Chart>
</div>
</body>
</html>
<%@ Page Language="vb" Description="dotnetCHARTING Component" %>
<%@ Register TagPrefix="dotnet" Namespace="dotnetCHARTING" Assembly="dotnetCHARTING"%>
<%@ Import Namespace="System.Drawing" %>
<%@ Import Namespace="System.Drawing.Drawing2D" %>
<%@ Import Namespace="dotnetCHARTING.Mapping" %>
<html xmlns="http://www.w3.org/1999/xhtml">
<head>
<title>.netCHARTING Sample</title>
<script runat="server">
' Demonstrates how to load an ecw file in combination with a shape file.
Sub Page_Load(ByVal sender As Object, ByVal e As EventArgs)
' This sample uses a pre-generated image. To run the sample live,
' please uncomment the code below,
' download ecw.zip form https://dotnetcharting.com/ecw.zip and copy the ecw dlls in your application's bin directoy.
'dotnetCHARTING.Chart worldChart = new dotnetCHARTING.Chart();
'worldChart.Type = ChartType.Map;
'worldChart.Size = "1000x450";
'worldChart.Title = "Satellite composite image layer";
'worldChart.TempDirectory = "temp";
'MapLayer layer = MapDataEngine.LoadLayer( "../../images/MapFiles/worldmap.ecw");
'worldChart.Mapping.MapLayerCollection.Add(layer);
'Controls.Add(worldChart);
Chart2.Type = ChartType.Map
Chart2.Size = "1000x550"
Chart2.Title = "Loading the United States shape file"
Chart2.TempDirectory = "temp"
Chart2.ChartArea.Background = New Background(Color.FromArgb(142,195,236),Color.FromArgb(63,137,200),90)
Chart2.Mapping.ZoomPercentage = 98
Chart2.Mapping.ZoomCenterPoint = New PointF(44,-120)
Dim layerStates2 As MapLayer = MapDataEngine.LoadLayer("../../images/MapFiles/states.shp")
layerStates2.DefaultShape.Label.Text = "%STATE_ABBR"
layerStates2.DefaultShape.Label.Color = Color.Blue
layerStates2.DefaultShape.Label.OutlineColor = Color.White
layerStates2.DefaultShape.Label.Font = New Font("Arial", 7)
layerStates2.DefaultShape.Background.Color = Color.PapayaWhip
layerStates2.DefaultShape.Line.Color = Color.White
Chart2.Mapping.MapLayerCollection.Add(layerStates2)
Chart3.Type = ChartType.Map
Chart3.Size = "1000x500"
Chart3.Title = "Combining United states shapefile with satellite image layer"
Chart3.TempDirectory = "temp"
Dim layerJpg As MapLayer = MapDataEngine.LoadLayer("","../../images/MapFiles/NorthAmerica.jpg")
Chart3.Mapping.MapLayerCollection.Add(layerJpg)
Chart3.Mapping.Projection.Type = ProjectionType.LambertConic
Chart3.Mapping.Projection.Parameters = "-96, 40, 32, 50"
Chart3.Mapping.DefaultShape.Line.Color = Color.LightGray
Dim layerStates3 As MapLayer = MapDataEngine.LoadLayer("../../images/MapFiles/states.shp")
layerStates3.DefaultShape.Label.Text = "%STATE_ABBR"
layerStates3.DefaultShape.Label.Color = Color.Black
layerStates3.DefaultShape.Label.OutlineColor = Color.White
layerStates3.DefaultShape.Label.Font = New Font("Arial", 7)
Chart3.Mapping.MapLayerCollection.Add(layerStates3)
End Sub
</script>
</head>
<body>
<div style="text-align:center">
<img alt="World Map" src="temp/worldmap.png"/>
<dotnet:Chart id="Chart2" runat="server" >
</dotnet:Chart>
<dotnet:Chart id="Chart3" runat="server" >
</dotnet:Chart>
</div>
</body>
</html>
- Sample FilenameLoadEcwFile.aspx
- Version4.0
- Uses DatabaseNo