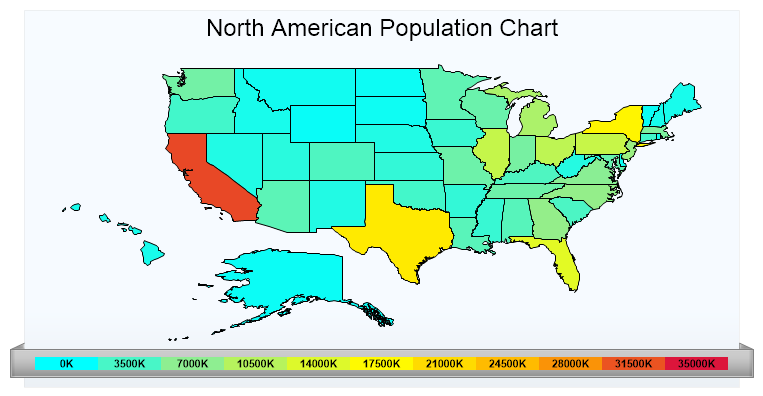
Mapping Range Colors
Demonstrates using range colors with maps.
<%@ Page Language="C#" Description="dotnetCHARTING Component" %>
<%@ Register TagPrefix="dotnet" Namespace="dotnetCHARTING" Assembly="dotnetCHARTING" %>
<%@ Import Namespace="System.Drawing" %>
<%@ Import Namespace="System.Drawing.Drawing2D" %>
<%@ Import Namespace="dotnetCHARTING.Mapping" %>
<html xmlns="http://www.w3.org/1999/xhtml">
<head>
<title>.netCHARTING Sample</title>
<script runat="server">
// Demonstrates using range colors with maps.
void Page_Load(Object sender, EventArgs e)
{
Chart.Type = ChartType.Map;
Chart.Size = "750x400";
Chart.TempDirectory = "temp";
Chart.Debug = true;
Chart.TitleBox.Position = TitleBoxPosition.Full;
Chart.LegendBox.Visible = false;
Chart.MarginLeft = 15;
Chart.MarginRight = 15;
Chart.MarginTop = -15;
Chart.ChartArea.Label.Text = "North American Population Chart";
Chart.ChartArea.Label.Font = new Font("Arial", 18);
Chart.ChartArea.Label.Alignment = StringAlignment.Center;
Chart.ChartArea.Background.Color = Color.FromArgb(200,243,249,255);
styleBox(Chart.TitleBox);
MapLayer layer = MapDataEngine.LoadLayer("../../images/MapFiles/primusa.shp");
Chart.Mapping.MapLayerCollection.Add(layer);
Chart.SmartPalette.Add("POPULATION", new SmartColor(Color.Aqua, Color.LightGreen, new ScaleRange(0, 7000000)));
Chart.SmartPalette.Add("POPULATION", new SmartColor(Color.LightGreen, Color.Yellow, new ScaleRange(7000000, 17000000)));
Chart.SmartPalette.Add("POPULATION", new SmartColor(Color.Yellow, Color.Orange, new ScaleRange(17000000, 27000000)));
Chart.SmartPalette.Add("POPULATION", new SmartColor(Color.Orange, Color.Crimson, new ScaleRange(27000000, 35000000)));
Chart.TitleBox.Header.Label.Text = getSwatch(600, Chart.SmartPalette, 10);
}
string getSwatch(int width, SmartPalette sp, int divisions)
{
double max = (double)sp.GetScaleRange("*").ValueHigh;
string swatch = "", spacers = "";
int boxWidth = width / divisions;
for (int i = 0; i <= divisions; i++)
{
spacers += "<Chart:Spacer size='" + boxWidth + "x1'>";
string c = getHTMLColor(sp.GetValueColor("*", (i * (max / divisions))));
swatch += "<block hAlign='Center' bgColor='" + c + "' fColor='Black' fStyle='Bold'>" + (i * (max / divisions) / 1000) + "K";
}
return spacers + "<row>" + swatch;
}
string getHTMLColor(Color c)
{
return "#" + c.R.ToString("X2") + c.G.ToString("X2") + c.B.ToString("X2");
}
private void styleBox(dotnetCHARTING.Box b)
{
b.Padding = 10;
b.Header.Orientation = dotnetCHARTING.Orientation.Bottom;
b.Header.StartCap = BoxCapStyle.RibbonUp;
b.Header.EndCap = BoxCapStyle.RibbonUp;
b.Header.Background.ShadingEffectMode = ShadingEffectMode.Seven;
b.Header.Background.Color = Color.FromArgb(169, 169, 169);
b.Header.Offset = new Point(0, -10);
}
</script>
</head>
<body>
<div style="text-align: center">
<dotnet:Chart ID="Chart" runat="server">
</dotnet:Chart>
</div>
</body>
</html>
<%@ Page Language="vb" Description="dotnetCHARTING Component" %>
<%@ Register TagPrefix="dotnet" Namespace="dotnetCHARTING" Assembly="dotnetCHARTING" %>
<%@ Import Namespace="System.Drawing" %>
<%@ Import Namespace="System.Drawing.Drawing2D" %>
<%@ Import Namespace="dotnetCHARTING.Mapping" %>
<html xmlns="http://www.w3.org/1999/xhtml">
<head>
<title>.netCHARTING Sample</title>
<script runat="server">
' Demonstrates using range colors with maps.
Sub Page_Load(ByVal sender As Object, ByVal e As EventArgs)
Chart.Type = ChartType.Map
Chart.Size = "750x400"
Chart.TempDirectory = "temp"
Chart.Debug = True
Chart.TitleBox.Position = TitleBoxPosition.Full
Chart.LegendBox.Visible = False
Chart.MarginLeft = 15
Chart.MarginRight = 15
Chart.MarginTop = -15
Chart.ChartArea.Label.Text = "North American Population Chart"
Chart.ChartArea.Label.Font = New Font("Arial", 18)
Chart.ChartArea.Label.Alignment = StringAlignment.Center
Chart.ChartArea.Background.Color = Color.FromArgb(200,243,249,255)
styleBox(Chart.TitleBox)
Dim layer As MapLayer = MapDataEngine.LoadLayer("../../images/MapFiles/primusa.shp")
Chart.Mapping.MapLayerCollection.Add(layer)
Chart.SmartPalette.Add("POPULATION", New SmartColor(Color.Aqua, Color.LightGreen, New ScaleRange(0, 7000000)))
Chart.SmartPalette.Add("POPULATION", New SmartColor(Color.LightGreen, Color.Yellow, New ScaleRange(7000000, 17000000)))
Chart.SmartPalette.Add("POPULATION", New SmartColor(Color.Yellow, Color.Orange, New ScaleRange(17000000, 27000000)))
Chart.SmartPalette.Add("POPULATION", New SmartColor(Color.Orange, Color.Crimson, New ScaleRange(27000000, 35000000)))
Chart.TitleBox.Header.Label.Text = getSwatch(600, Chart.SmartPalette, 10)
End Sub
Function getSwatch(ByVal width As Integer, ByVal sp As SmartPalette, ByVal divisions As Integer) As String
Dim max As Double = CDbl(sp.GetScaleRange("*").ValueHigh)
Dim swatch As String = "", spacers As String = ""
Dim boxWidth As Integer = width / divisions
For i As Integer = 0 To divisions
spacers &= "<Chart:Spacer size='" & boxWidth & "x1'>"
Dim c As String = getHTMLColor(sp.GetValueColor("*", (i * (max / divisions))))
swatch &= "<block hAlign='Center' bgColor='" & c & "' fColor='Black' fStyle='Bold'>" & (i * (max / divisions) / 1000) & "K"
Next i
Return spacers & "<row>" & swatch
End Function
Function getHTMLColor(ByVal c As Color) As String
Return "#" & c.R.ToString("X2") + c.G.ToString("X2") + c.B.ToString("X2")
End Function
Private Sub styleBox(ByVal b As dotnetCHARTING.Box)
b.Padding = 10
b.Header.Orientation = dotnetCHARTING.Orientation.Bottom
b.Header.StartCap = BoxCapStyle.RibbonUp
b.Header.EndCap = BoxCapStyle.RibbonUp
b.Header.Background.ShadingEffectMode = ShadingEffectMode.Seven
b.Header.Background.Color = Color.FromArgb(169, 169, 169)
b.Header.Offset = New Point(0, -10)
End Sub
</script>
</head>
<body>
<div style="text-align: center">
<dotnet:Chart ID="Chart" runat="server">
</dotnet:Chart>
</div>
</body>
</html>