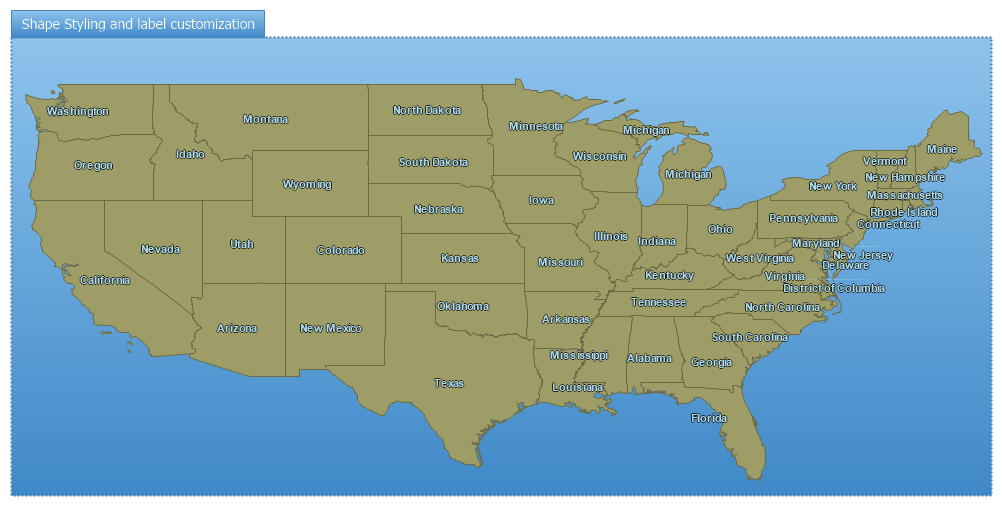
Shape Styling
Demonstrates styling of shapefile shapes.
<%@ Page Language="C#" Description="dotnetCHARTING Component" %>
<%@ Register TagPrefix="dotnet" Namespace="dotnetCHARTING" Assembly="dotnetCHARTING"%>
<%@ Import Namespace="System.Drawing" %>
<%@ Import Namespace="dotnetCHARTING.Mapping" %>
<html xmlns="http://www.w3.org/1999/xhtml">
<head>
<title>.netCHARTING Sample</title>
<script runat="server">
// Demonstrates how to set different style properties.
void Page_Load(Object sender,EventArgs e)
{
Chart.Type = ChartType.Map;
Chart.Size = "1000x500";
Chart.Title = "Shape Styling and label customization";
Chart.TempDirectory = "temp";
Chart.Mapping.MapLayerCollection.Add("../../images/MapFiles/states.shp");
Chart.Mapping.ZoomPercentage = 190;
Chart.Mapping.ZoomCenterPoint = new PointF(38,-96);
// Properties for setting ChartArea style
Chart.ChartArea.Background.Mode = BackgroundMode.Color;
Chart.ChartArea.Background = new Background(Color.FromArgb(142,195,236),Color.FromArgb(63,137,200),90);
Chart.ChartArea.Line.Color = Color.SteelBlue;
Chart.ChartArea.Line.DashStyle = System.Drawing.Drawing2D.DashStyle.Dot;
Chart.ChartArea.Line.Width=2;
// Properties for setting TitleBox style
Chart.TitleBox.Background = new Background(Color.FromArgb(142,195,236),Color.FromArgb(63,137,200),90);
Chart.TitleBox.Label.Color = Color.White;
Chart.TitleBox.Line.Color = Color.SteelBlue;
Chart.TitleBox.CornerTopLeft = BoxCorner.Square;
// Shape style properties
Chart.Mapping.DefaultShape.Line.Color = Color.FromArgb(107,106,69);
Chart.Mapping.DefaultShape.Line.DashStyle = System.Drawing.Drawing2D.DashStyle.Solid;
Chart.Mapping.DefaultShape.Line.Width=1;
Chart.Mapping.DefaultShape.Background.Mode = BackgroundMode.Color;
Chart.Mapping.DefaultShape.Background.Color = Color.FromArgb(158,157,103);
Chart.Mapping.DefaultShape.Label.Text = "%State_Name";
Chart.Mapping.DefaultShape.Label.OutlineColor = Color.Black;
Chart.Mapping.DefaultShape.Label.Color = Color.LightBlue;
Chart.Mapping.DefaultShape.Label.Font = new Font("Arial",8,System.Drawing.FontStyle.Bold);
//Chart.Mapping.DefaultShape.Marker.Type = ElementMarkerType.Triangle;
//Chart.Mapping.DefaultShape.Marker.Color = Color.Blue;
//Chart.Mapping.DefaultShape.Marker.Size =12;
}
</script>
</head>
<body>
<div style="text-align:center">
<dotnet:Chart id="Chart" runat="server" >
</dotnet:Chart>
</div>
</body>
</html>
<%@ Page Language="vb" Description="dotnetCHARTING Component" %>
<%@ Register TagPrefix="dotnet" Namespace="dotnetCHARTING" Assembly="dotnetCHARTING"%>
<%@ Import Namespace="System.Drawing" %>
<%@ Import Namespace="dotnetCHARTING.Mapping" %>
<html xmlns="http://www.w3.org/1999/xhtml">
<head>
<title>.netCHARTING Sample</title>
<script runat="server">
' Demonstrates how to set different style properties.
Sub Page_Load(ByVal sender As Object, ByVal e As EventArgs)
Chart.Type = ChartType.Map
Chart.Size = "1000x500"
Chart.Title = "Shape Styling and label customization"
Chart.TempDirectory = "temp"
Chart.Mapping.MapLayerCollection.Add("../../images/MapFiles/states.shp")
Chart.Mapping.ZoomPercentage = 190
Chart.Mapping.ZoomCenterPoint = New PointF(38,-96)
' Properties for setting ChartArea style
Chart.ChartArea.Background.Mode = BackgroundMode.Color
Chart.ChartArea.Background = New Background(Color.FromArgb(142,195,236),Color.FromArgb(63,137,200),90)
Chart.ChartArea.Line.Color = Color.SteelBlue
Chart.ChartArea.Line.DashStyle = System.Drawing.Drawing2D.DashStyle.Dot
Chart.ChartArea.Line.Width=2
' Properties for setting TitleBox style
Chart.TitleBox.Background = New Background(Color.FromArgb(142,195,236),Color.FromArgb(63,137,200),90)
Chart.TitleBox.Label.Color = Color.White
Chart.TitleBox.Line.Color = Color.SteelBlue
Chart.TitleBox.CornerTopLeft = BoxCorner.Square
' Shape style properties
Chart.Mapping.DefaultShape.Line.Color = Color.FromArgb(107,106,69)
Chart.Mapping.DefaultShape.Line.DashStyle = System.Drawing.Drawing2D.DashStyle.Solid
Chart.Mapping.DefaultShape.Line.Width=1
Chart.Mapping.DefaultShape.Background.Mode = BackgroundMode.Color
Chart.Mapping.DefaultShape.Background.Color = Color.FromArgb(158,157,103)
Chart.Mapping.DefaultShape.Label.Text = "%State_Name"
Chart.Mapping.DefaultShape.Label.OutlineColor = Color.Black
Chart.Mapping.DefaultShape.Label.Color = Color.LightBlue
Chart.Mapping.DefaultShape.Label.Font = New Font("Arial",8,System.Drawing.FontStyle.Bold)
'Chart.Mapping.DefaultShape.Marker.Type = ElementMarkerType.Triangle;
'Chart.Mapping.DefaultShape.Marker.Color = Color.Blue;
'Chart.Mapping.DefaultShape.Marker.Size =12;
End Sub
</script>
</head>
<body>
<div style="text-align:center">
<dotnet:Chart id="Chart" runat="server" >
</dotnet:Chart>
</div>
</body>
</html>