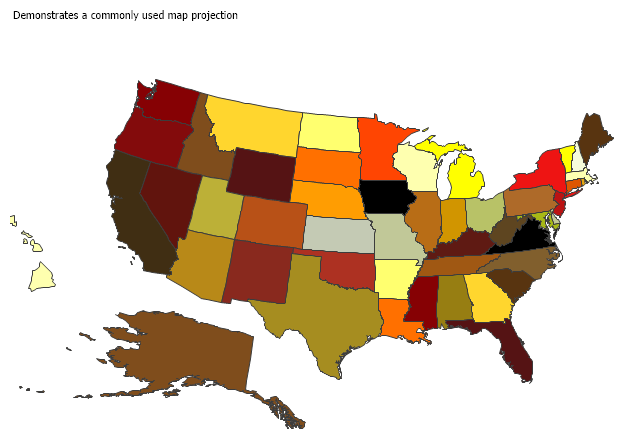
<%@ Page Language="C#" Description="dotnetCHARTING Component" %><%@ Register TagPrefix="dotnet" Namespace="dotnetCHARTING" Assembly="dotnetCHARTING" %><%@ Import Namespace="System.Drawing" %><%@ Import Namespace="System.Drawing.Drawing2D" %><%@ Import Namespace="dotnetCHARTING.Mapping" %><html xmlns="http://www.w3.org/1999/xhtml"><head> <title>.netCHARTING Sample</title> <script runat="server"> void Page_Load(Object sender, EventArgs e) { // Demonstrates commonly used projections. Chart.Type = ChartType.Map; Chart.Size = "650x500"; //Chart.Title = "Chart Sample"; Chart.TempDirectory = "temp"; Chart.Debug = true; Chart.TitleBox.Position = TitleBoxPosition.Full; Chart.LegendBox.Visible = false; Chart.ChartArea.Label.Text = "Demonstrates a commonly used map projection"; Chart.Mapping.Projection.Type = ProjectionType.LambertConic; Chart.ChartArea.Line.Color = Color.Transparent; // Both of these projection parameters can be used. //Chart.Mapping.Projection.Parameters = "-100,35,-25,86"; Chart.Mapping.Projection.Parameters = "-92,40,35,45"; Chart.Mapping.ZoomPercentage = 150; Chart.Mapping.ZoomCenterPoint = new PointF(36, -98); MapLayer layer = MapDataEngine.LoadLayer("../../images/MapFiles/primusa.shp"); Chart.Mapping.DefaultShape.Hotspot.ToolTip = "Tip"; layer.DefaultShape.Hotspot.ToolTip = "Tip"; layer.PaletteName = Palette.Autumn; Chart.Mapping.MapLayerCollection.Add(layer); } </script></head><body> <div style="text-align: center"> <dotnet:Chart ID="Chart" runat="server"> </dotnet:Chart> </div></body></html>
<%@ Page Language="vb" Description="dotnetCHARTING Component" %><%@ Register TagPrefix="dotnet" Namespace="dotnetCHARTING" Assembly="dotnetCHARTING" %><%@ Import Namespace="System.Drawing" %><%@ Import Namespace="System.Drawing.Drawing2D" %><%@ Import Namespace="dotnetCHARTING.Mapping" %><html xmlns="http://www.w3.org/1999/xhtml"><head> <title>.netCHARTING Sample</title> <script runat="server"> Sub Page_Load(ByVal sender As Object, ByVal e As EventArgs) ' Demonstrates commonly used projections. Chart.Type = ChartType.Map Chart.Size = "650x500" 'Chart.Title = "Chart Sample"; Chart.TempDirectory = "temp" Chart.Debug = True Chart.TitleBox.Position = TitleBoxPosition.Full Chart.LegendBox.Visible = False Chart.ChartArea.Label.Text = "Demonstrates a commonly used map projection" Chart.Mapping.Projection.Type = ProjectionType.LambertConic Chart.ChartArea.Line.Color = Color.Transparent ' Both of these projection parameters can be used. 'Chart.Mapping.Projection.Parameters = "-100,35,-25,86"; Chart.Mapping.Projection.Parameters = "-92,40,35,45" Chart.Mapping.ZoomPercentage = 150 Chart.Mapping.ZoomCenterPoint = New PointF(36, -98) Dim layer As MapLayer = MapDataEngine.LoadLayer("../../images/MapFiles/primusa.shp") Chart.Mapping.DefaultShape.Hotspot.ToolTip = "Tip" layer.DefaultShape.Hotspot.ToolTip = "Tip" layer.PaletteName = Palette.Autumn Chart.Mapping.MapLayerCollection.Add(layer) End Sub </script></head><body> <div style="text-align: center"> <dotnet:Chart ID="Chart" runat="server"> </dotnet:Chart> </div></body></html>