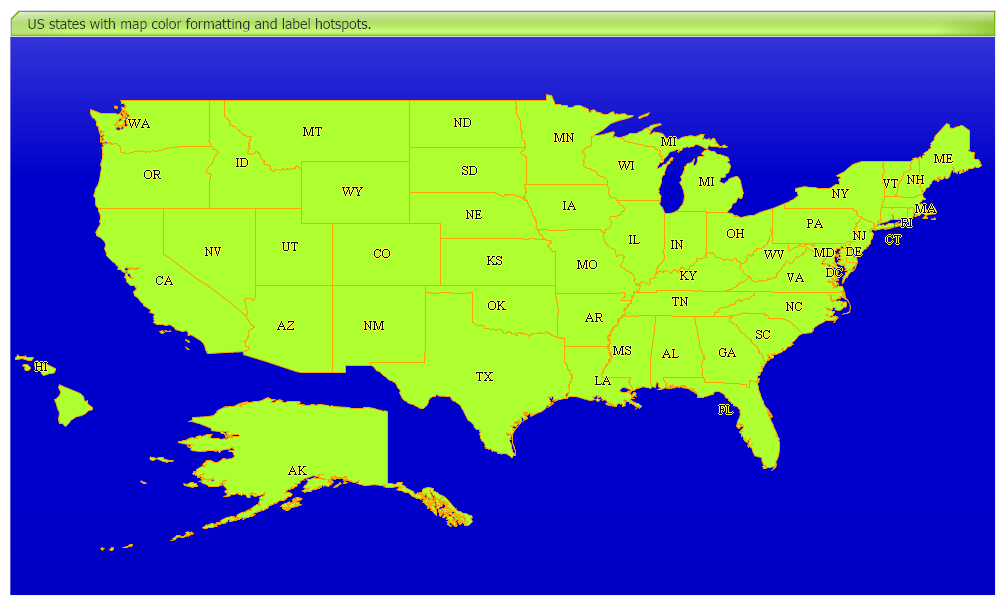
<%@ Page Language="C#" Description="dotnetCHARTING Component" %><%@ Register TagPrefix="dotnet" Namespace="dotnetCHARTING" Assembly="dotnetCHARTING"%><%@ Import Namespace="System.Drawing" %><%@ Import Namespace="System.Data" %><%@ Import Namespace="System.Data.OleDb" %><%@ Import Namespace="dotnetCHARTING.Mapping" %><html xmlns="http://www.w3.org/1999/xhtml"> <head> <title>.netCHARTING Sample</title> <script runat="server">void Page_Load(Object sender,EventArgs e){ Chart.Type = ChartType.Map; Chart.Size = "1000x600"; Chart.Title = " US states with map color formatting and label hotspots."; Chart.TempDirectory = "temp"; Chart.Mapping.DefaultShape.Line.Color = Color.Orange; Chart.Mapping.DefaultShape.Line.Width = 1; Chart.Mapping.DefaultShape.Background.Color = Color.GreenYellow; Chart.Mapping.DefaultShape.Label.Color = Color.Black; Chart.Mapping.DefaultShape.Label.Font = new Font("Times New Roman", 10); Chart.Mapping.DefaultShape.Label.OutlineColor = Color.Yellow; Chart.TitleBox.Background.Color = Color.GreenYellow; Chart.TitleBox.Background.GlassEffect = true; Chart.ChartArea.Background.Color = Color.MediumBlue; //Loads the primusa.shp file . MapLayer layer = MapDataEngine.LoadLayer("../../images/MapFiles/primusa.shp"); Chart.Mapping.ZoomPercentage = 120; Chart.Mapping.ZoomCenterPoint = new PointF(35,-98); Chart.TitleBox.Position = TitleBoxPosition.FullWithLegend; Chart.Mapping.MapLayerCollection.Add(layer); Chart.Mapping.DefaultShape.Label.Text = "%State_ABBR"; Chart.Mapping.DefaultShape.Label.Hotspot.ToolTip = "%State_Name"; }</script> </head> <body> <div style="text-align:center"> <dotnet:Chart id="Chart" runat="server" > </dotnet:Chart> </div> </body></html>
<%@ Page Language="vb" Description="dotnetCHARTING Component" %><%@ Register TagPrefix="dotnet" Namespace="dotnetCHARTING" Assembly="dotnetCHARTING"%><%@ Import Namespace="System.Drawing" %><%@ Import Namespace="System.Data" %><%@ Import Namespace="System.Data.OleDb" %><%@ Import Namespace="dotnetCHARTING.Mapping" %><html xmlns="http://www.w3.org/1999/xhtml"> <head> <title>.netCHARTING Sample</title> <script runat="server">Sub Page_Load(ByVal sender As Object, ByVal e As EventArgs) Chart.Type = ChartType.Map Chart.Size = "1000x600" Chart.Title = " US states with map color formatting and label hotspots." Chart.TempDirectory = "temp" Chart.Mapping.DefaultShape.Line.Color = Color.Orange Chart.Mapping.DefaultShape.Line.Width = 1 Chart.Mapping.DefaultShape.Background.Color = Color.GreenYellow Chart.Mapping.DefaultShape.Label.Color = Color.Black Chart.Mapping.DefaultShape.Label.Font = New Font("Times New Roman", 10) Chart.Mapping.DefaultShape.Label.OutlineColor = Color.Yellow Chart.TitleBox.Background.Color = Color.GreenYellow Chart.TitleBox.Background.GlassEffect = True Chart.ChartArea.Background.Color = Color.MediumBlue 'Loads the primusa.shp file . Dim layer As MapLayer = MapDataEngine.LoadLayer("../../images/MapFiles/primusa.shp") Chart.Mapping.ZoomPercentage = 120 Chart.Mapping.ZoomCenterPoint = New PointF(35,-98) Chart.TitleBox.Position = TitleBoxPosition.FullWithLegend Chart.Mapping.MapLayerCollection.Add(layer) Chart.Mapping.DefaultShape.Label.Text = "%State_ABBR" Chart.Mapping.DefaultShape.Label.Hotspot.ToolTip = "%State_Name"End Sub</script> </head> <body> <div style="text-align:center"> <dotnet:Chart id="Chart" runat="server" > </dotnet:Chart> </div> </body></html>