Gallery
<%@ Page Language="C#" Description="dotnetCHARTING Component" %>
<%@ Register TagPrefix="dotnet" Namespace="dotnetCHARTING" Assembly="dotnetCHARTING"%>
<%@ Import Namespace="System.Drawing" %>
<%@ Import Namespace="System.Drawing.Drawing2D" %>
<%@ Import Namespace="dotnetCHARTING.Mapping" %>
<script runat="server">
void Page_Load(Object sender,EventArgs e)
{
Chart.Type = ChartType.Map;//Horizontal;
Chart.Size = "580x550";
Chart.TempDirectory = "temp";
Chart.Debug = true;
Chart.ChartArea.Background.Color = Color.FromArgb(255,243,249,255);
//Chart.Title = ".netCHARTING Sample";
// Demonstrates using a legend with maps.
MapLayer layer = MapDataEngine.LoadLayer( @"../../images/MapFiles/states.shp");//,"mapFiles/worldmapc.jpg");
Chart.Mapping.MapLayerCollection.Add(layer);
// This line will cause the legend to appear, however, it may not contain the correct column template to display information pertaining to the chart.
layer.PaletteName = Palette.Bright;
// Set some legendbox properties.
Chart.LegendBox.Template = "%State_ABBR%ICON%Value";
Chart.LegendBox.DefaultEntry.Value = "<%Population,###,###.>";
Chart.LegendBox.Orientation = dotnetCHARTING.Orientation.Bottom;
Chart.LegendBox.ClearColors();
// Setup a header
Chart.LegendBox.HeaderEntry.Value = "Population";
Chart.LegendBox.HeaderEntry.CustomAttributes.Add("State_ABBR","State");
Chart.LegendBox.HeaderEntry.CustomAttributes["Icon"] = "Color";
Chart.LegendBox.HeaderEntry.Visible = true;
Chart.LegendBox.HeaderEntry.HeaderMode = LegendEntryHeaderMode.RepeatOnEachColumn;
}
</script>
<html xmlns="http://www.w3.org/1999/xhtml">
<head>
<title>.netCHARTING Sample</title> </head>
<body>
<div align="center">
<dotnet:Chart id="Chart" runat="server"/>
</div>
</body>
</html>
<%@ Page Language="vb" Description="dotnetCHARTING Component" %>
<%@ Register TagPrefix="dotnet" Namespace="dotnetCHARTING" Assembly="dotnetCHARTING"%>
<%@ Import Namespace="System.Drawing" %>
<%@ Import Namespace="System.Drawing.Drawing2D" %>
<%@ Import Namespace="dotnetCHARTING.Mapping" %>
<script runat="server">
Sub Page_Load(ByVal sender As Object, ByVal e As EventArgs)
Chart.Type = ChartType.Map 'Horizontal;
Chart.Size = "580x550"
Chart.TempDirectory = "temp"
Chart.Debug = True
Chart.ChartArea.Background.Color = Color.FromArgb(255,243,249,255)
'Chart.Title = ".netCHARTING Sample";
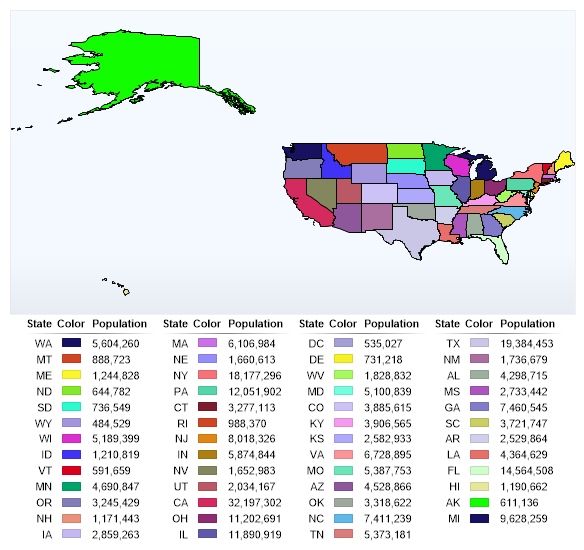
' Demonstrates using a legend with maps.
Dim layer As MapLayer = MapDataEngine.LoadLayer("../../images/MapFiles/states.shp") ',"mapFiles/worldmapc.jpg");
Chart.Mapping.MapLayerCollection.Add(layer)
' This line will cause the legend to appear, however, it may not contain the correct column template to display information pertaining to the chart.
layer.PaletteName = Palette.Bright
' Set some legendbox properties.
Chart.LegendBox.Template = "%State_ABBR%ICON%Value"
Chart.LegendBox.DefaultEntry.Value = "<%Population,###,###.>"
Chart.LegendBox.Orientation = dotnetCHARTING.Orientation.Bottom
Chart.LegendBox.ClearColors()
' Setup a header
Chart.LegendBox.HeaderEntry.Value = "Population"
Chart.LegendBox.HeaderEntry.CustomAttributes.Add("State_ABBR","State")
Chart.LegendBox.HeaderEntry.CustomAttributes("Icon") = "Color"
Chart.LegendBox.HeaderEntry.Visible = True
Chart.LegendBox.HeaderEntry.HeaderMode = LegendEntryHeaderMode.RepeatOnEachColumn
End Sub
</script>
<html xmlns="http://www.w3.org/1999/xhtml">
<head>
<title>.netCHARTING Sample</title> </head>
<body>
<div align="center">
<dotnet:Chart id="Chart" runat="server"/>
</div>
</body>
</html>
- Sample FilenameMapLegend.aspx
- Version4.1
- Uses DatabaseNo