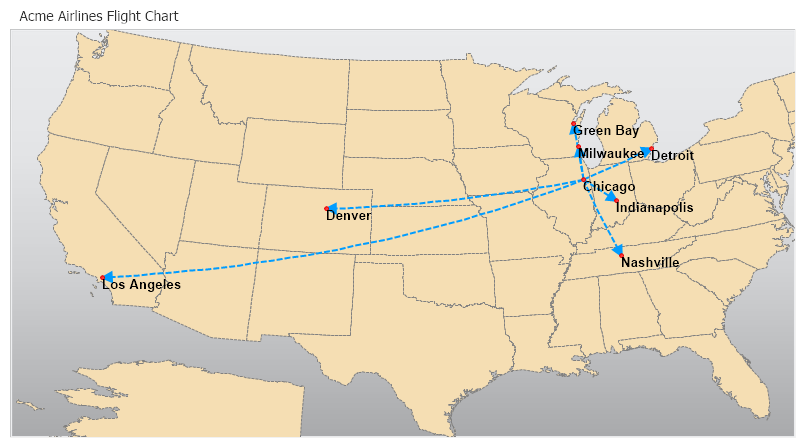
Map Add Line
Demonstrates manually adding lines to a map.
<%@ Page Language="C#" Description="dotnetCHARTING Component" %>
<%@ Register TagPrefix="dotnet" Namespace="dotnetCHARTING" Assembly="dotnetCHARTING"%>
<%@ Import Namespace="System.Drawing" %>
<%@ Import Namespace="System.Drawing.Drawing2D" %>
<%@ Import Namespace="dotnetCHARTING.Mapping" %>
<html xmlns="http://www.w3.org/1999/xhtml">
<head>
<title>.netCHARTING Sample</title>
<script runat="server">
void Page_Load(Object sender,EventArgs e)
{
// Demonstrates manually adding lines to a map.
Chart.Type = ChartType.Map;
Chart.Size = "800x450";
Chart.Title = "Acme Airlines Flight Chart";
Chart.TempDirectory = "temp";
Chart.Debug=true;
Chart.TitleBox.Position = TitleBoxPosition.Full;
Chart.LegendBox.Visible = false;
Chart.ChartArea.Background.ShadingEffectMode = ShadingEffectMode.Seven;
Chart.Mapping.Projection.Type = ProjectionType.LambertConic;
Chart.Mapping.Projection.Parameters = "-100,35,-25,86";
Chart.Mapping.ZoomCenterPoint = new PointF( 37,-100);
Chart.Mapping.ZoomPercentage = 180;
Chart.Mapping.DefaultShape.Label.Font = new Font("Arial", 10,FontStyle.Bold);
Chart.Mapping.DefaultShape.Label.Color = Color.Black;
// Add the map layer.
MapLayer layer = MapDataEngine.LoadLayer("../../images/MapFiles/primusa.shp");
layer.DefaultShape.Background.Color = Color.Wheat;
layer.DefaultShape.Line.Color = Color.Gray;
layer.DefaultShape.Line.DashStyle = DashStyle.Dash;
Chart.Mapping.MapLayerCollection.Add(layer);
// Add a lines layer.
MapLayer layer2 = new MapLayer();
Line l = new Line(Color.FromArgb(0, 156, 255));
l.EndCap = LineCap.ArrowAnchor;
l.AnchorCapScale = 3;
l.DashStyle = DashStyle.Dash;
l.Width = 2;
layer2.AddLine(new PointF(-88, 41), new PointF(-86.09f,39.4606f), l);
layer2.AddLine(new PointF(-88, 41), new PointF(-87.97714f, 44.502508f), l);
layer2.AddLine(new PointF(-88, 41), new PointF(-87.89679f, 43.050601f), l);
layer2.AddLine(new PointF(-88, 41), new PointF(-83.0604f, 42.347429f), l);
layer2.AddLine(new PointF(-88, 41), new PointF(-86.47000f, 36.095700f), l);
layer2.AddLine(new PointF(-88, 41), new PointF(-104.99459f, 39.749107f), l);
layer2.AddLine(new PointF(-88, 41), new PointF(-118.143f, 34.030800f), l);
Chart.Mapping.MapLayerCollection.Add(layer2);
// Add a point layer with labels.
MapLayer layer3 = new MapLayer();
ElementMarker em = new ElementMarker(ElementMarkerType.Circle, 4, Color.Red);
layer3.AddLatLongPoint(new Point(41, -88), em);
layer3.AddPoint(new PointF(-87.97714f, 44.502508f), em);
layer3.AddPoint(new PointF(-87.89679f, 43.050601f), em);
layer3.AddPoint(new PointF(-83.0604f, 42.347429f), em);
layer3.AddPoint(new PointF(-86.47000f, 36.095700f), em);
layer3.AddPoint(new PointF(-104.99459f, 39.749107f), em);
layer3.AddPoint(new PointF(-118.143f, 34.030800f), em);
layer3.AddPoint(new PointF(-86.09f, 39.4606f), em);
layer3.Shapes[0].Label.Text = "Chicago";
layer3.Shapes[1].Label.Text = "Green Bay";
layer3.Shapes[2].Label.Text = "Milwaukee";
layer3.Shapes[3].Label.Text = "Detroit";
layer3.Shapes[4].Label.Text = "Nashville";
layer3.Shapes[5].Label.Text = "Denver";
layer3.Shapes[6].Label.Text = "Los Angeles";
layer3.Shapes[7].Label.Text = "Indianapolis";
Chart.Mapping.MapLayerCollection.Add(layer3);
}
</script>
</head>
<body>
<div style="text-align:center">
<dotnet:Chart id="Chart" runat="server" >
</dotnet:Chart>
</div>
</body>
</html>
<%@ Page Language="vb" Description="dotnetCHARTING Component" %>
<%@ Register TagPrefix="dotnet" Namespace="dotnetCHARTING" Assembly="dotnetCHARTING"%>
<%@ Import Namespace="System.Drawing" %>
<%@ Import Namespace="System.Drawing.Drawing2D" %>
<%@ Import Namespace="dotnetCHARTING.Mapping" %>
<html xmlns="http://www.w3.org/1999/xhtml">
<head>
<title>.netCHARTING Sample</title>
<script runat="server">
Sub Page_Load(ByVal sender As Object, ByVal e As EventArgs)
' Demonstrates manually adding lines to a map.
Chart.Type = ChartType.Map
Chart.Size = "800x450"
Chart.Title = "Acme Airlines Flight Chart"
Chart.TempDirectory = "temp"
Chart.Debug=True
Chart.TitleBox.Position = TitleBoxPosition.Full
Chart.LegendBox.Visible = False
Chart.ChartArea.Background.ShadingEffectMode = ShadingEffectMode.Seven
Chart.Mapping.Projection.Type = ProjectionType.LambertConic
Chart.Mapping.Projection.Parameters = "-100,35,-25,86"
Chart.Mapping.ZoomCenterPoint = New PointF(37,-100)
Chart.Mapping.ZoomPercentage = 180
Chart.Mapping.DefaultShape.Label.Font = New Font("Arial", 10,FontStyle.Bold)
Chart.Mapping.DefaultShape.Label.Color = Color.Black
' Add the map layer.
Dim layer As MapLayer = MapDataEngine.LoadLayer("../../images/MapFiles/primusa.shp")
layer.DefaultShape.Background.Color = Color.Wheat
layer.DefaultShape.Line.Color = Color.Gray
layer.DefaultShape.Line.DashStyle = DashStyle.Dash
Chart.Mapping.MapLayerCollection.Add(layer)
' Add a lines layer.
Dim layer2 As MapLayer = New MapLayer()
Dim l As Line = New Line(Color.FromArgb(0, 156, 255))
l.EndCap = LineCap.ArrowAnchor
l.AnchorCapScale = 3
l.DashStyle = DashStyle.Dash
l.Width = 2
layer2.AddLine(New PointF(-88, 41), New PointF(-86.09f,39.4606f), l)
layer2.AddLine(New PointF(-88, 41), New PointF(-87.97714f, 44.502508f), l)
layer2.AddLine(New PointF(-88, 41), New PointF(-87.89679f, 43.050601f), l)
layer2.AddLine(New PointF(-88, 41), New PointF(-83.0604f, 42.347429f), l)
layer2.AddLine(New PointF(-88, 41), New PointF(-86.47000f, 36.095700f), l)
layer2.AddLine(New PointF(-88, 41), New PointF(-104.99459f, 39.749107f), l)
layer2.AddLine(New PointF(-88, 41), New PointF(-118.143f, 34.030800f), l)
Chart.Mapping.MapLayerCollection.Add(layer2)
' Add a point layer with labels.
Dim layer3 As MapLayer = New MapLayer()
Dim em As ElementMarker = New ElementMarker(ElementMarkerType.Circle, 4, Color.Red)
layer3.AddLatLongPoint(New Point(41, -88), em)
layer3.AddPoint(New PointF(-87.97714f, 44.502508f), em)
layer3.AddPoint(New PointF(-87.89679f, 43.050601f), em)
layer3.AddPoint(New PointF(-83.0604f, 42.347429f), em)
layer3.AddPoint(New PointF(-86.47000f, 36.095700f), em)
layer3.AddPoint(New PointF(-104.99459f, 39.749107f), em)
layer3.AddPoint(New PointF(-118.143f, 34.030800f), em)
layer3.AddPoint(New PointF(-86.09f, 39.4606f), em)
layer3.Shapes(0).Label.Text = "Chicago"
layer3.Shapes(1).Label.Text = "Green Bay"
layer3.Shapes(2).Label.Text = "Milwaukee"
layer3.Shapes(3).Label.Text = "Detroit"
layer3.Shapes(4).Label.Text = "Nashville"
layer3.Shapes(5).Label.Text = "Denver"
layer3.Shapes(6).Label.Text = "Los Angeles"
layer3.Shapes(7).Label.Text = "Indianapolis"
Chart.Mapping.MapLayerCollection.Add(layer3)
End Sub
</script>
</head>
<body>
<div style="text-align:center">
<dotnet:Chart id="Chart" runat="server" >
</dotnet:Chart>
</div>
</body>
</html>