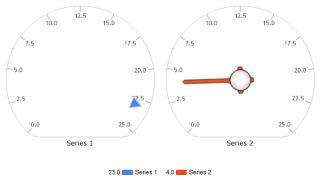
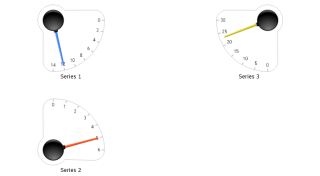
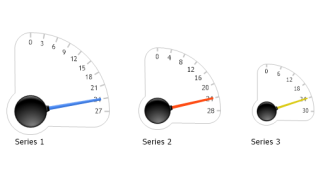
- Gauge Multi Needles
How multiple needles behave on a gauge chart.
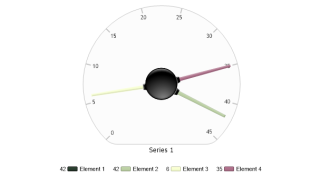
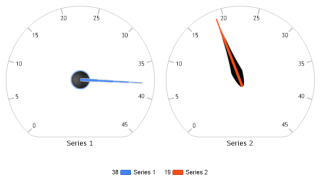
- Gauge Needles With Markers
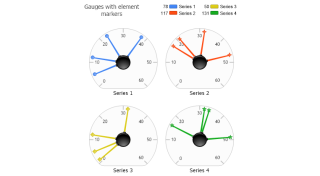
Demonstrates using element markers on gauge needles.
- Gauge Styling
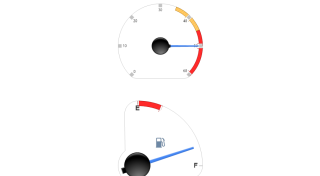
Some gauge styling methods.
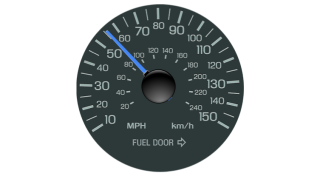
- Gauge Clock
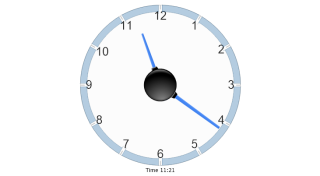
Demonstrates a gauge chart created to look like a clock and displaying current server time.
- Gauge Angles
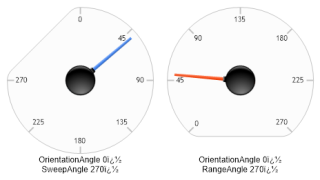
Manipulate gauge axis orientation and sweep angles.
- Gauge Markers
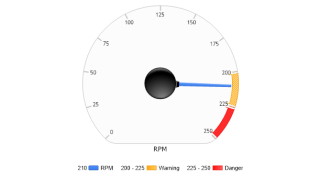
Use axis markers on gauge axes.
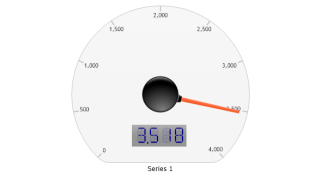
- Default Gauge Clipping
Demonstrates the automatic padding behavior when a single gauge is used with a cleared chart area and no legend box.
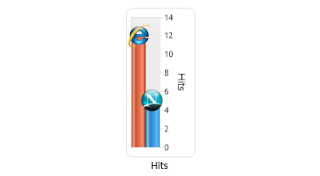
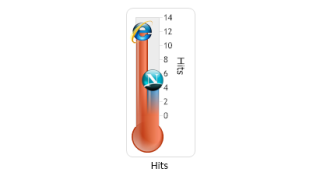
- Gauge Custom Needle
Demonstrates using a custom image with a dynamic color for gauge needles.
- Gauge Custom Needle 2
Demonstrates using a custom image with a dynamic color for gauge needles.
- Gauge HRange Tick
Demonstrates a horizontal linear gauge using shading effect one, an axis marker and element marker range tick.
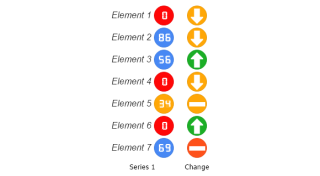
- Gauge Indicator Lights By Value
Demonstrates gauge indicator lights using values above and below 0 to indicate status.
- Gauge Linear Dynamic Color Markers
Demonstrates linear horizontal gauges with custom image markers employing DynamicColors.
- Gauge Linear Forced Markers
Demonstrates a vertical linear gauge using shading effect Three and Forced element image markers.
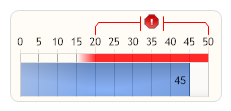
- Gauge Linear Scale Break
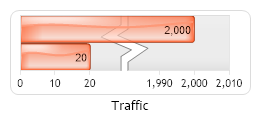
Demonstrates a horizontal linear gauge using shading effect Four and a scale break.
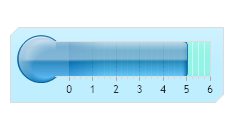
- Gauge Linear Styled
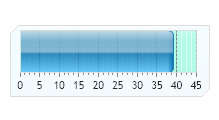
Demonstrates a horizontal linear gauge using shading effect two.
- Gauge Linear Styled 2
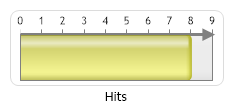
Demonstrates a horizontal linear gauge using shading effect Three and customized axis line.
- Gauge Linear VAxis Markers
Demonstrates a vertical linear gauge using shading effect one with gradient axis markers and image axis ticks.
- Gauge Linear VSTyled
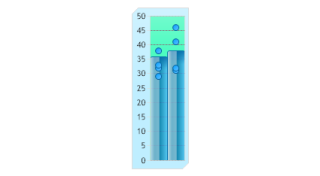
Demonstrates a vertical linear gauge using shading effect two and subvalues.
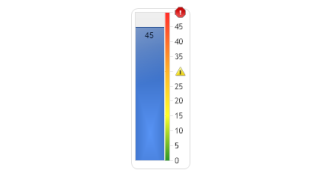
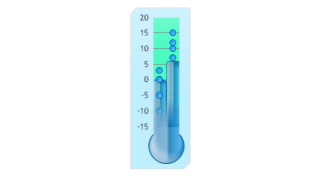
- Gauge Thermometer Axis Markers
Demonstrates a vertical thermometer gauge using shading effect one, gradient axis markers and image axis ticks.
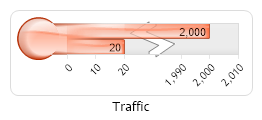
- Gauge Thermometer Axis Range Tick Marker
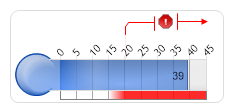
Demonstrates a horizontal thermometer gauge using shading effect one, axis marker and custom image range axis tick.
- Gauge Thermometer Forced Markers
Demonstrates a vertical thermometer gauge using shading effect Three and forced custom image element markers.
- Gauge Thermometer Scale Break
Demonstrates a horizontal thermometer gauge using shading effect Four and a scale break.
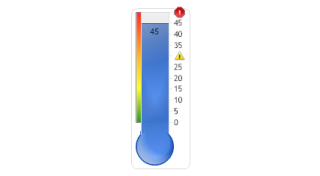
- Gauge Thermometer Styled
Demonstrates a vertical thermometer gauge using shading effect two and sub values.
- Gauge Thermometer Styled 2
Demonstrates a horizontal thermometer gauge using shading effect two.
- Gauge Thermometer Styled 3
Demonstrates a horizontal thermometer gauge using shading effect Three and a custom axis line.
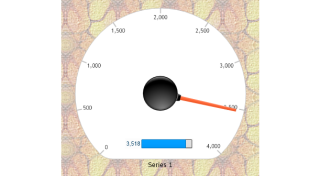
- Gauge Background
How Gauge backgrounds can be used.
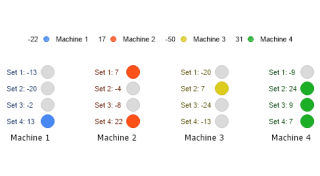
- Multi Row Indicators
Demonstrates using multiple rows of indicator lights on a chart.
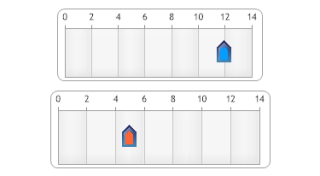
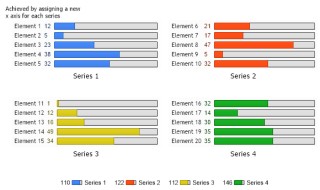
- Axis Line And Markers
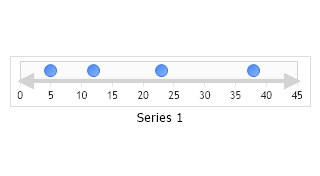
Demonstrates how to set up a gauge with markers and a string x axis with arrows.
- Compound Gauge
Demonstrates using compounded gauges.
- Compound Gauge 2
Demonstrates using compounded gauges.
- Gauge Absolute Position
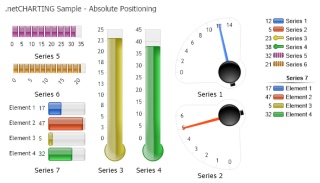
Demonstrates using absolute positioning of several gauges on a single chart.
- Gauge Rectangles
Demonstrates specifying a rectangle where the gauge will render.
- Gauge Sizing
Demonstrates specifying a gauge's size.
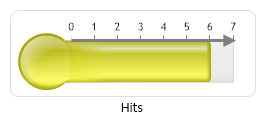
- Image Bar Gauge
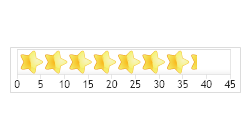
Demonstrates using ImageBars with a horizontal gauge.
- Image Bar One To One 4
Demonstrates using the ImageBarSyncToValue feature where the image bars repeat the same number of times as represented by the element's value.
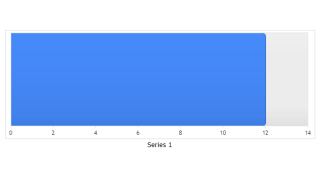
- Progress Bar 2
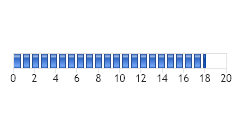
Demonstrates how to set up a progress bar.
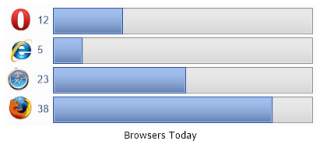
- Gauge Bars Diff Names
Demonstrates how to have bars gauges show different element names.
- Gauge Face Hotspot
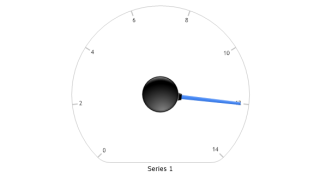
Demonstrates using a gauge with a single needle and make the element ToolTip encompass the gauge face.
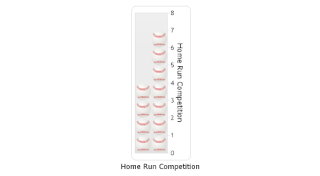
- Bar Gauge Images
Demonstrates using images in axis ticks with gauge bars chart. Chart.