Gallery
Gauge Indicator Lights By Value
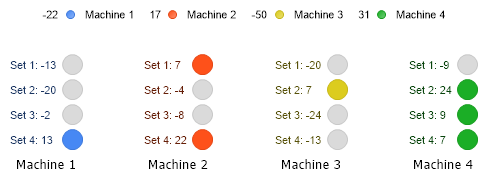
Demonstrates gauge indicator lights using values above and below 0 to indicate status.
- Sample FilenameGaugeIndicatorLightsByValue.aspx
- Version4.3
- Uses DatabaseNo