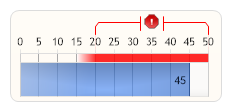
Gauge HRange Tick
Demonstrates a horizontal linear gauge using shading effect one, an axis marker and element marker range tick.
<%@ Page Language="C#" Description="dotnetCHARTING Component" %>
<%@ Register TagPrefix="dotnet" Namespace="dotnetCHARTING" Assembly="dotnetCHARTING" %>
<%@ Import Namespace="System.Drawing" %>
<%@ Import Namespace="System.Drawing.Drawing2D" %>
<%@ Import Namespace="dotnetCHARTING.Mapping" %>
<script runat="server">
void Page_Load(Object sender, EventArgs e)
{
// Demonstrates a horizontal linear gauge using shading effect one, an axis marker and element marker range tick.
Chart.Size = "220x150";
Chart.TempDirectory = "temp";
Chart.Debug = true;
Chart.LegendBox.Visible = false;
Chart.Type = ChartType.Gauges;
Chart.DefaultSeries.GaugeType = GaugeType.Horizontal;
Chart.ShadingEffectMode = ShadingEffectMode.One;
Chart.ChartArea.Padding = 2;
Chart.Margin = "-1";
Chart.ChartArea.ClearColors();
Chart.DefaultElement.ShowValue = true;
Chart.YAxis.Orientation = dotnetCHARTING.Orientation.Top;
Chart.YAxis.DefaultTick.GridLine.Color = Color.DarkGray;
Chart.DefaultSeries.Background.Color = Color.FromArgb(10, Color.Orange);
Chart.DefaultSeries.GaugeBorderBox.DefaultCorner = BoxCorner.Round;
Chart.DefaultSeries.GaugeBorderShape = GaugeBorderShape.UseBox;
Chart.DefaultElement.Transparency = 30;
Chart.YAxis.TickLabelPadding = 1;
Chart.YAxis.Markers.Add(new AxisMarker("", Color.Red, 20, 50));
Chart.YAxis.Markers.Add(new AxisMarker("", new Background(Color.White, Color.Red, 0), 15, 20));
AxisTick at = new AxisTick(20, 50, "Warning");
at.Marker = new ElementMarker("../../images/error2.png");
at.Line.Color = Color.Red;
at.Label.Color = Color.Red;
at.Label.Font = new Font("Arial", 9, FontStyle.Bold);
Chart.YAxis.ExtraTicks.Add(at);
// *DYNAMIC DATA NOTE*
// This sample uses random data to populate the chart. To populate
// a chart with database data see the following resources:
// - Help File > Getting Started > Data Tutorials
// - DataEngine Class in the help file
// - Sample: features/DataEngine.aspx
SeriesCollection mySC = getRandomData();
// Add the random data.
Chart.SeriesCollection.Add(mySC);
}
SeriesCollection getRandomData()
{
return new SeriesCollection(new Series("", new Element("Element 1", 45)));
}
</script>
<html xmlns="http://www.w3.org/1999/xhtml">
<head>
<title>.netCHARTING Sample</title>
</head>
<body>
<div align="center">
<dotnet:Chart ID="Chart" runat="server" />
</div>
</body>
</html>
<%@ Page Language="vb" Description="dotnetCHARTING Component" %>
<%@ Register TagPrefix="dotnet" Namespace="dotnetCHARTING" Assembly="dotnetCHARTING" %>
<%@ Import Namespace="System.Drawing" %>
<%@ Import Namespace="System.Drawing.Drawing2D" %>
<%@ Import Namespace="dotnetCHARTING.Mapping" %>
<script runat="server">
Sub Page_Load(ByVal sender As Object, ByVal e As EventArgs)
' Demonstrates a horizontal linear gauge using shading effect one, an axis marker and element marker range tick.
Chart.Size = "220x150"
Chart.TempDirectory = "temp"
Chart.Debug = True
Chart.LegendBox.Visible = False
Chart.Type = ChartType.Gauges
Chart.DefaultSeries.GaugeType = GaugeType.Horizontal
Chart.ShadingEffectMode = ShadingEffectMode.One
Chart.ChartArea.Padding = 2
Chart.Margin = "-1"
Chart.ChartArea.ClearColors()
Chart.DefaultElement.ShowValue = True
Chart.YAxis.Orientation = dotnetCHARTING.Orientation.Top
Chart.YAxis.DefaultTick.GridLine.Color = Color.DarkGray
Chart.DefaultSeries.Background.Color = Color.FromArgb(10, Color.Orange)
Chart.DefaultSeries.GaugeBorderBox.DefaultCorner = BoxCorner.Round
Chart.DefaultSeries.GaugeBorderShape = GaugeBorderShape.UseBox
Chart.DefaultElement.Transparency = 30
Chart.YAxis.TickLabelPadding = 1
Chart.YAxis.Markers.Add(New AxisMarker("", Color.Red, 20, 50))
Chart.YAxis.Markers.Add(New AxisMarker("", New Background(Color.White, Color.Red, 0), 15, 20))
Dim at As AxisTick = New AxisTick(20, 50, "Warning")
at.Marker = New ElementMarker("../../images/error2.png")
at.Line.Color = Color.Red
at.Label.Color = Color.Red
at.Label.Font = New Font("Arial", 9, FontStyle.Bold)
Chart.YAxis.ExtraTicks.Add(at)
' *DYNAMIC DATA NOTE*
' This sample uses random data to populate the chart. To populate
' a chart with database data see the following resources:
' - Help File > Getting Started > Data Tutorials
' - DataEngine Class in the help file
' - Sample: features/DataEngine.aspx
Dim mySC As SeriesCollection = getRandomData()
' Add the random data.
Chart.SeriesCollection.Add(mySC)
End Sub
Function getRandomData() As SeriesCollection
Return New SeriesCollection(New Series("", New Element("Element 1", 45)))
End Function
</script>
<html xmlns="http://www.w3.org/1999/xhtml">
<head>
<title>.netCHARTING Sample</title>
</head>
<body>
<div align="center">
<dotnet:Chart ID="Chart" runat="server" />
</div>
</body>
</html>