Gallery
Axis Line And Markers
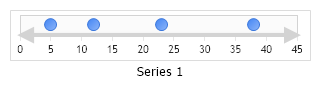
Demonstrates how to set up a gauge with markers and a string x axis with arrows.
- Sample FilenameAxisLineAndMarkers.aspx
- Version4.4
- Uses DatabaseNo