Gallery
<%@ Page Language="C#" Description="dotnetCHARTING Component" %>
<%@ Register TagPrefix="dotnet" Namespace="dotnetCHARTING" Assembly="dotnetCHARTING"%>
<%@ Import Namespace="System.Drawing" %>
<%@ Import Namespace="System.Drawing.Drawing2D" %>
<html xmlns="http://www.w3.org/1999/xhtml">
<head>
<title>.netCHARTING Sample</title>
<script runat="server">
void Page_Load(Object sender,EventArgs e)
{
Chart.Type = ChartType.Gauges;
Chart.Width = 600;
Chart.Height = 350;
Chart.TempDirectory = "temp";
Chart.Debug = true;
// Demonstrates how to use axis markers on gauge axes.
// First create a series. If you would like to get the data from a database you need to use
// the data engine. See sample: features/dataEngine.aspx. Or the dataEngine tutorial in the help file.
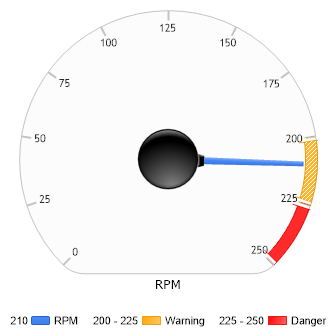
Series s = new Series("RPM", new Element("e1",210));
// Create an axis marker.
AxisMarker am1 = new AxisMarker("Danger",new Background(Color.Red),225,250);
// Create a background
Background bg = new Background(Color.Orange);
bg.HatchStyle = HatchStyle.LightUpwardDiagonal;
bg.HatchColor = Color.White;
// Create another axis marker.
AxisMarker am2 = new AxisMarker("Warning",bg,200,225);
// Add the markers to the main y axis.
Chart.YAxis.Markers.Add(am2);
Chart.YAxis.Markers.Add(am1);
Chart.YAxis.Interval = 25;
Chart.YAxis.Maximum = 250;
// Add the random data.
Chart.SeriesCollection.Add(s);
}
</script>
</head>
<body>
<div style="text-align:center">
<dotnet:Chart id="Chart" runat="server" Width="568px" Height="344px">
</dotnet:Chart>
</div>
</body>
</html>
<%@ Page Language="vb" Description="dotnetCHARTING Component" %>
<%@ Register TagPrefix="dotnet" Namespace="dotnetCHARTING" Assembly="dotnetCHARTING"%>
<%@ Import Namespace="System.Drawing" %>
<%@ Import Namespace="System.Drawing.Drawing2D" %>
<html xmlns="http://www.w3.org/1999/xhtml">
<head>
<title>.netCHARTING Sample</title>
<script runat="server">
Sub Page_Load(ByVal sender As Object, ByVal e As EventArgs)
Chart.Type = ChartType.Gauges
Chart.Width = 600
Chart.Height = 350
Chart.TempDirectory = "temp"
Chart.Debug = True
' Demonstrates how to use axis markers on gauge axes.
' First create a series. If you would like to get the data from a database you need to use
' the data engine. See sample: features/dataEngine.aspx. Or the dataEngine tutorial in the help file.
Dim s As Series = New Series("RPM", New Element("e1",210))
' Create an axis marker.
Dim am1 As AxisMarker = New AxisMarker("Danger",New Background(Color.Red),225,250)
' Create a background
Dim bg As Background = New Background(Color.Orange)
bg.HatchStyle = HatchStyle.LightUpwardDiagonal
bg.HatchColor = Color.White
' Create another axis marker.
Dim am2 As AxisMarker = New AxisMarker("Warning",bg,200,225)
' Add the markers to the main y axis.
Chart.YAxis.Markers.Add(am2)
Chart.YAxis.Markers.Add(am1)
Chart.YAxis.Interval = 25
Chart.YAxis.Maximum = 250
' Add the random data.
Chart.SeriesCollection.Add(s)
End Sub
</script>
</head>
<body>
<div style="text-align:center">
<dotnet:Chart id="Chart" runat="server" Width="568px" Height="344px">
</dotnet:Chart>
</div>
</body>
</html>
- Sample FilenameGaugeMarkers.aspx
- VersionLegacy (Pre 3.0)
- Uses DatabaseNo