Gallery
Image Bar One To One 4
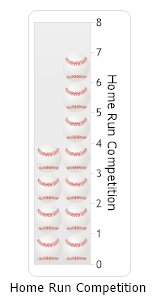
Demonstrates using the ImageBarSyncToValue feature where the image bars repeat the same number of times as represented by the element's value.
- Sample FilenameImageBarOneToOne4.aspx
- Version4.4
- Uses DatabaseNo