Gallery
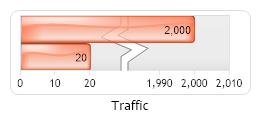
Gauge Linear Scale Break
<%@ Page Language="C#" Description="dotnetCHARTING Component" %>
<%@ Register TagPrefix="dotnet" Namespace="dotnetCHARTING" Assembly="dotnetCHARTING" %>
<%@ Import Namespace="System.Drawing" %>
<%@ Import Namespace="System.Drawing.Drawing2D" %>
<%@ Import Namespace="dotnetCHARTING.Mapping" %>
<script runat="server">
void Page_Load(Object sender, EventArgs e)
{
// Demonstrates a horizontal linear gauge using shading effect Four and a scale break.
Chart.Size = "250x140";
Chart.TempDirectory = "temp";
Chart.Debug = true;
Chart.Palette = new Color[] { Color.FromArgb(255, 99, 49), Color.FromArgb(0, 156, 255) };
Chart.LegendBox.Visible = false;
Chart.Type = ChartType.Gauges;
Chart.DefaultSeries.GaugeType = GaugeType.Horizontal;
Chart.ShadingEffectMode = ShadingEffectMode.Four;
Chart.DefaultElement.Transparency = 30;
Chart.ChartArea.Padding = 3;
Chart.Margin = "-2";
Chart.ChartArea.ClearColors();
Chart.DefaultElement.ShowValue = true;
Chart.YAxis.ScaleBreaks.Add(new ScaleRange(30, 1980));
Chart.DefaultSeries.GaugeBorderBox.DefaultCorner = BoxCorner.Round;
Chart.DefaultSeries.GaugeBorderShape = GaugeBorderShape.UseBox;
// *DYNAMIC DATA NOTE*
// This sample uses random data to populate the chart. To populate
// a chart with database data see the following resources:
// - Help File > Getting Started > Data Tutorials
// - DataEngine Class in the help file
// - Sample: features/DataEngine.aspx
SeriesCollection mySC = getRandomData();
mySC[0][0].YValue = 20;
mySC[0][1].YValue = 2000;
// Add the random data.
Chart.SeriesCollection.Add(mySC);
}
SeriesCollection getRandomData()
{
Random myR = new Random();
SeriesCollection SC = new SeriesCollection();
for (int a = 1; a < 2; a++)
{
Series s = new Series("Traffic");
for (int b = 1; b < 3; b++)
{
Element e = new Element("Element " + b.ToString());
e.YValue = myR.Next(50);
s.Elements.Add(e);
}
SC.Add(s);
}
return SC;
}
</script>
<html xmlns="http://www.w3.org/1999/xhtml">
<head>
<title>.netCHARTING Sample</title>
</head>
<body>
<div align="center">
<dotnet:Chart ID="Chart" runat="server" />
</div>
</body>
</html>
<%@ Page Language="vb" Description="dotnetCHARTING Component" %>
<%@ Register TagPrefix="dotnet" Namespace="dotnetCHARTING" Assembly="dotnetCHARTING" %>
<%@ Import Namespace="System.Drawing" %>
<%@ Import Namespace="System.Drawing.Drawing2D" %>
<%@ Import Namespace="dotnetCHARTING.Mapping" %>
<script runat="server">
Sub Page_Load(ByVal sender As Object, ByVal e As EventArgs)
' Demonstrates a horizontal linear gauge using shading effect Four and a scale break.
Chart.Size = "250x140"
Chart.TempDirectory = "temp"
Chart.Debug = True
Chart.Palette = New Color() { Color.FromArgb(255, 99, 49), Color.FromArgb(0, 156, 255) }
Chart.LegendBox.Visible = False
Chart.Type = ChartType.Gauges
Chart.DefaultSeries.GaugeType = GaugeType.Horizontal
Chart.ShadingEffectMode = ShadingEffectMode.Four
Chart.DefaultElement.Transparency = 30
Chart.ChartArea.Padding = 3
Chart.Margin = "-2"
Chart.ChartArea.ClearColors()
Chart.DefaultElement.ShowValue = True
Chart.YAxis.ScaleBreaks.Add(New ScaleRange(30, 1980))
Chart.DefaultSeries.GaugeBorderBox.DefaultCorner = BoxCorner.Round
Chart.DefaultSeries.GaugeBorderShape = GaugeBorderShape.UseBox
' *DYNAMIC DATA NOTE*
' This sample uses random data to populate the chart. To populate
' a chart with database data see the following resources:
' - Help File > Getting Started > Data Tutorials
' - DataEngine Class in the help file
' - Sample: features/DataEngine.aspx
Dim mySC As SeriesCollection = getRandomData()
mySC(0)(0).YValue = 20
mySC(0)(1).YValue = 2000
' Add the random data.
Chart.SeriesCollection.Add(mySC)
End Sub
Function getRandomData() As SeriesCollection
Dim myR As Random = New Random()
Dim SC As SeriesCollection = New SeriesCollection()
For a As Integer = 1 To 1
Dim s As Series = New Series("Traffic")
For b As Integer = 1 To 2
Dim e As Element = New Element("Element " & b.ToString())
e.YValue = myR.Next(50)
s.Elements.Add(e)
Next b
SC.Add(s)
Next a
Return SC
End Function
</script>
<html xmlns="http://www.w3.org/1999/xhtml">
<head>
<title>.netCHARTING Sample</title>
</head>
<body>
<div align="center">
<dotnet:Chart ID="Chart" runat="server" />
</div>
</body>
</html>
- Sample FilenameGaugeLinearScaleBreak.aspx
- Version4.3
- Uses DatabaseNo