Gallery
Gauge Linear Styled
<%@ Page Language="C#" Description="dotnetCHARTING Component" %>
<%@ Register TagPrefix="dotnet" Namespace="dotnetCHARTING" Assembly="dotnetCHARTING" %>
<%@ Import Namespace="System.Drawing" %>
<%@ Import Namespace="System.Drawing.Drawing2D" %>
<%@ Import Namespace="dotnetCHARTING.Mapping" %>
<script runat="server">
void Page_Load(Object sender, EventArgs e)
{
// Demonstrates a horizontal linear gauge using shading effect two.
Chart.Size = "220x110";
Chart.TempDirectory = "temp";
Chart.Debug = true;
Chart.Palette = new Color[] { Color.FromArgb(0, 156, 255) };
Chart.LegendBox.Visible = false;
Chart.Type = ChartType.Gauges;
Chart.DefaultSeries.GaugeType = GaugeType.Horizontal;
Chart.ShadingEffectMode = ShadingEffectMode.Two;
Chart.ChartArea.ClearColors();
Chart.YAxis.MinorTicksPerInterval = 3;
Chart.YAxis.DefaultMinorTick.Line.Color = Color.Gray;
Chart.YAxis.DefaultMinorTick.GridLine.Color = Color.White;
Chart.YAxis.DefaultMinorTick.GridLine.DashStyle = DashStyle.Dot;
Chart.YAxis.DefaultTick.GridLine.Color = Color.Gray;
Chart.YAxis.DefaultTick.Line.Color = Color.Gray;
Chart.YAxis.ZeroTick.Line.Color = Color.Gray;
Chart.YAxis.DefaultTick.GridLine.DashStyle = DashStyle.Dash;
Chart.DefaultElement.Transparency = 20;
Chart.DefaultSeries.GaugeBorderBox.CornerTopLeft = BoxCorner.Cut;
Chart.DefaultSeries.GaugeBorderBox.CornerBottomRight = BoxCorner.Cut;
Chart.DefaultSeries.GaugeBorderShape = GaugeBorderShape.UseBox;
Chart.DefaultSeries.GaugeBorderBox.Background.Color = Color.FromArgb(100,77,251,192);
Chart.DefaultSeries.Background.Color = Color.FromArgb(60,204, 240, 255);
// *DYNAMIC DATA NOTE*
// This sample uses random data to populate the chart. To populate
// a chart with database data see the following resources:
// - Help File > Getting Started > Data Tutorials
// - DataEngine Class in the help file
// - Sample: features/DataEngine.aspx
SeriesCollection mySC = getRandomData();
// Add the random data.
Chart.SeriesCollection.Add(mySC);
}
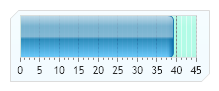
SeriesCollection getRandomData()
{
return new SeriesCollection(new Series("", new Element("Element 1", 39)));
}
</script>
<html xmlns="http://www.w3.org/1999/xhtml">
<head>
<title>.netCHARTING Sample</title>
</head>
<body>
<div align="center">
<dotnet:Chart ID="Chart" runat="server" />
</div>
</body>
</html>
<%@ Page Language="vb" Description="dotnetCHARTING Component" %>
<%@ Register TagPrefix="dotnet" Namespace="dotnetCHARTING" Assembly="dotnetCHARTING" %>
<%@ Import Namespace="System.Drawing" %>
<%@ Import Namespace="System.Drawing.Drawing2D" %>
<%@ Import Namespace="dotnetCHARTING.Mapping" %>
<script runat="server">
Sub Page_Load(ByVal sender As Object, ByVal e As EventArgs)
' Demonstrates a horizontal linear gauge using shading effect two.
Chart.Size = "220x110"
Chart.TempDirectory = "temp"
Chart.Debug = True
Chart.Palette = New Color() { Color.FromArgb(0, 156, 255) }
Chart.LegendBox.Visible = False
Chart.Type = ChartType.Gauges
Chart.DefaultSeries.GaugeType = GaugeType.Horizontal
Chart.ShadingEffectMode = ShadingEffectMode.Two
Chart.ChartArea.ClearColors()
Chart.YAxis.MinorTicksPerInterval = 3
Chart.YAxis.DefaultMinorTick.Line.Color = Color.Gray
Chart.YAxis.DefaultMinorTick.GridLine.Color = Color.White
Chart.YAxis.DefaultMinorTick.GridLine.DashStyle = DashStyle.Dot
Chart.YAxis.DefaultTick.GridLine.Color = Color.Gray
Chart.YAxis.DefaultTick.Line.Color = Color.Gray
Chart.YAxis.ZeroTick.Line.Color = Color.Gray
Chart.YAxis.DefaultTick.GridLine.DashStyle = DashStyle.Dash
Chart.DefaultElement.Transparency = 20
Chart.DefaultSeries.GaugeBorderBox.CornerTopLeft = BoxCorner.Cut
Chart.DefaultSeries.GaugeBorderBox.CornerBottomRight = BoxCorner.Cut
Chart.DefaultSeries.GaugeBorderShape = GaugeBorderShape.UseBox
Chart.DefaultSeries.GaugeBorderBox.Background.Color = Color.FromArgb(100,77,251,192)
Chart.DefaultSeries.Background.Color = Color.FromArgb(60,204, 240, 255)
' *DYNAMIC DATA NOTE*
' This sample uses random data to populate the chart. To populate
' a chart with database data see the following resources:
' - Help File > Getting Started > Data Tutorials
' - DataEngine Class in the help file
' - Sample: features/DataEngine.aspx
Dim mySC As SeriesCollection = getRandomData()
' Add the random data.
Chart.SeriesCollection.Add(mySC)
End Sub
Function getRandomData() As SeriesCollection
Return New SeriesCollection(New Series("", New Element("Element 1", 39)))
End Function
</script>
<html xmlns="http://www.w3.org/1999/xhtml">
<head>
<title>.netCHARTING Sample</title>
</head>
<body>
<div align="center">
<dotnet:Chart ID="Chart" runat="server" />
</div>
</body>
</html>
- Sample FilenameGaugeLinearStyled.aspx
- Version4.3
- Uses DatabaseNo