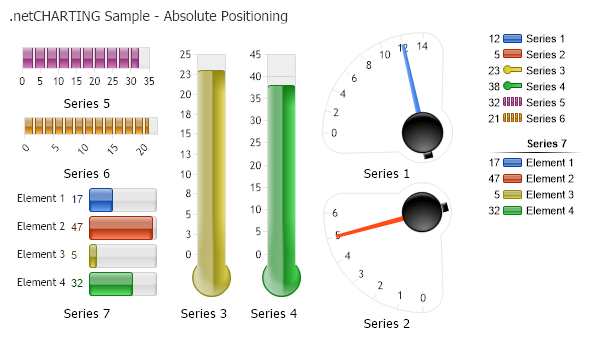
Gauge Absolute Position
Demonstrates using absolute positioning of several gauges on a single chart.
<%@ Page Language="C#" Description="dotnetCHARTING Component" %>
<%@ Register TagPrefix="dotnet" Namespace="dotnetCHARTING" Assembly="dotnetCHARTING" %>
<%@ Import Namespace="System.Drawing" %>
<script runat="server">
void Page_Load(Object sender, EventArgs e)
{
// Demonstrates using absolute positioning of several gauges on a single chart.
Chart.TempDirectory = "temp";
Chart.Debug = true;
Chart.Type = ChartType.Gauges;
Chart.DefaultSeries.GaugeType = GaugeType.Vertical;
Chart.DefaultSeries.GaugeBorderBox.Line.Color = Color.Transparent;
Chart.Size = "600x350";
Chart.OverlapFooter = true;
Chart.Title = ".netCHARTING Sample - Absolute Positioning";
Chart.ShadingEffectMode = ShadingEffectMode.Two;
Chart.LegendBox.Orientation = dotnetCHARTING.Orientation.TopRight;
Chart.DefaultAxis.FormatString = "n0";
// *DYNAMIC DATA NOTE*
// This sample uses random data to populate the chart. To populate
// a chart with database data see the following resources:
// - Help File > Getting Started > Data Tutorials
// - DataEngine Class in the help file
// - Sample: features/DataEngine.aspx
SeriesCollection mySC = getRandomData();
// Setup Gauges
mySC[0].YAxis = new Axis();
mySC[0].GaugeType = GaugeType.Circular;
mySC[0].YAxis.SweepAngle = 90;
mySC[0].YAxis.OrientationAngle = 270;
mySC[0].YAxis.DefaultTick.Line.Length = 6;
mySC[1].YAxis = new Axis();
mySC[1].GaugeType = GaugeType.Circular;
mySC[1].YAxis.SweepAngle = 90;
mySC[1].YAxis.OrientationAngle = 180;
mySC[1].YAxis.DefaultTick.Line.Length = 6;
// Thermometers
mySC[2].YAxis = new Axis();
mySC[2].GaugeType = GaugeType.Vertical;
mySC[2].GaugeLinearStyle = GaugeLinearStyle.Thermometer;
mySC[3].YAxis = new Axis();
mySC[3].GaugeType = GaugeType.Vertical;
mySC[3].GaugeLinearStyle = GaugeLinearStyle.Thermometer;
// Progress bars
mySC[4].YAxis = new Axis();
mySC[4].GaugeType = GaugeType.Horizontal;
mySC[4].Type = SeriesType.BarSegmented;
mySC[5].YAxis = new Axis();
mySC[5].GaugeType = GaugeType.Horizontal;
mySC[5].Type = SeriesType.BarSegmented;
// Bars
mySC[6].YAxis = new Axis();
mySC[6].GaugeType = GaugeType.Bars;
mySC[6].Palette = ChartPalettes.GetPalette(Palette.Default);
mySC[6].DefaultElement.LegendEntry.SortOrder = 3;
LegendEntry le = new LegendEntry("Series 7", "");
le.SortOrder = 2;
le.PaddingTop = 9;
le.DividerLine.Color = Color.Black;
le.LabelStyle.Font = new Font("Arial", 8, FontStyle.Bold);
Chart.LegendBox.ExtraEntries.Add(le);
// Specify Absolute Positions for each gauge
mySC[0].GaugeBorderBox.Position = new Rectangle(330, 40, 130, 130);
mySC[1].GaugeBorderBox.Position = new Rectangle(330, 190, 130, 130);
mySC[2].GaugeBorderBox.Position = new Rectangle(180, 50, 65, 260);
mySC[3].GaugeBorderBox.Position = new Rectangle(250, 50, 65, 260);
mySC[4].GaugeBorderBox.Position = new Rectangle(20, 50, 150, 50);
mySC[5].GaugeBorderBox.Position = new Rectangle(20, 120, 150, 50);
mySC[6].GaugeBorderBox.Position = new Rectangle(20, 190, 150, 120);
//mySC[2].GaugeBorderBox.Line.Color = Color.Red;
//mySC[3].GaugeBorderBox.Line.Color = Color.Red;
// Add the random data.
Chart.SeriesCollection.Add(mySC);
}
SeriesCollection getRandomData()
{
Random myR = new Random(1);
SeriesCollection SC = new SeriesCollection();
int a = 0, b = 0, c = 2;
for (a = 1; a < 8; a++)
{
c = 2;
if (a == 7) c = 5;
Series s = new Series("Series " + a.ToString());
for (b = 1; b < c; b++)
{
Element e = new Element("Element " + b.ToString());
e.YValue = myR.Next(50);
s.Elements.Add(e);
}
SC.Add(s);
}
return SC;
}
SeriesCollection getLiveData()
{
DataEngine de = new DataEngine("ConnectionString goes here");
de.ChartObject = Chart; // Necessary to view any errors the dataEngine may throw.
de.SqlStatement = "SELECT XAxisColumn, YAxisColumn FROM ....";
return de.GetSeries();
}
</script>
<html xmlns="http://www.w3.org/1999/xhtml">
<head>
<title>.netCHARTING Sample</title>
</head>
<body>
<div align="center">
<dotnet:Chart ID="Chart" runat="server" />
</div>
</body>
</html>
<%@ Page Language="vb" Description="dotnetCHARTING Component" %>
<%@ Register TagPrefix="dotnet" Namespace="dotnetCHARTING" Assembly="dotnetCHARTING" %>
<%@ Import Namespace="System.Drawing" %>
<script runat="server">
Sub Page_Load(ByVal sender As Object, ByVal e As EventArgs)
' Demonstrates using absolute positioning of several gauges on a single chart.
Chart.TempDirectory = "temp"
Chart.Debug = True
Chart.Type = ChartType.Gauges
Chart.DefaultSeries.GaugeType = GaugeType.Vertical
Chart.DefaultSeries.GaugeBorderBox.Line.Color = Color.Transparent
Chart.Size = "600x350"
Chart.OverlapFooter = True
Chart.Title = ".netCHARTING Sample - Absolute Positioning"
Chart.ShadingEffectMode = ShadingEffectMode.Two
Chart.LegendBox.Orientation = dotnetCHARTING.Orientation.TopRight
Chart.DefaultAxis.FormatString = "n0"
' *DYNAMIC DATA NOTE*
' This sample uses random data to populate the chart. To populate
' a chart with database data see the following resources:
' - Help File > Getting Started > Data Tutorials
' - DataEngine Class in the help file
' - Sample: features/DataEngine.aspx
Dim mySC As SeriesCollection = getRandomData()
' Setup Gauges
mySC(0).YAxis = New Axis()
mySC(0).GaugeType = GaugeType.Circular
mySC(0).YAxis.SweepAngle = 90
mySC(0).YAxis.OrientationAngle = 270
mySC(0).YAxis.DefaultTick.Line.Length = 6
mySC(1).YAxis = New Axis()
mySC(1).GaugeType = GaugeType.Circular
mySC(1).YAxis.SweepAngle = 90
mySC(1).YAxis.OrientationAngle = 180
mySC(1).YAxis.DefaultTick.Line.Length = 6
' Thermometers
mySC(2).YAxis = New Axis()
mySC(2).GaugeType = GaugeType.Vertical
mySC(2).GaugeLinearStyle = GaugeLinearStyle.Thermometer
mySC(3).YAxis = New Axis()
mySC(3).GaugeType = GaugeType.Vertical
mySC(3).GaugeLinearStyle = GaugeLinearStyle.Thermometer
' Progress bars
mySC(4).YAxis = New Axis()
mySC(4).GaugeType = GaugeType.Horizontal
mySC(4).Type = SeriesType.BarSegmented
mySC(5).YAxis = New Axis()
mySC(5).GaugeType = GaugeType.Horizontal
mySC(5).Type = SeriesType.BarSegmented
' Bars
mySC(6).YAxis = New Axis()
mySC(6).GaugeType = GaugeType.Bars
mySC(6).Palette = ChartPalettes.GetPalette(Palette.Default)
mySC(6).DefaultElement.LegendEntry.SortOrder = 3
Dim le As LegendEntry = New LegendEntry("Series 7", "")
le.SortOrder = 2
le.PaddingTop = 9
le.DividerLine.Color = Color.Black
le.LabelStyle.Font = New Font("Arial", 8, FontStyle.Bold)
Chart.LegendBox.ExtraEntries.Add(le)
' Specify Absolute Positions for each gauge
mySC(0).GaugeBorderBox.Position = New Rectangle(330, 40, 130, 130)
mySC(1).GaugeBorderBox.Position = New Rectangle(330, 190, 130, 130)
mySC(2).GaugeBorderBox.Position = New Rectangle(180, 50, 65, 260)
mySC(3).GaugeBorderBox.Position = New Rectangle(250, 50, 65, 260)
mySC(4).GaugeBorderBox.Position = New Rectangle(20, 50, 150, 50)
mySC(5).GaugeBorderBox.Position = New Rectangle(20, 120, 150, 50)
mySC(6).GaugeBorderBox.Position = New Rectangle(20, 190, 150, 120)
'mySC[2].GaugeBorderBox.Line.Color = Color.Red;
'mySC[3].GaugeBorderBox.Line.Color = Color.Red;
' Add the random data.
Chart.SeriesCollection.Add(mySC)
End Sub
Function getRandomData() As SeriesCollection
Dim myR As Random = New Random(1)
Dim SC As SeriesCollection = New SeriesCollection()
Dim a As Integer = 0, b As Integer = 0, c As Integer = 2
For a = 1 To 7
c = 2
If a = 7 Then
c = 5
End If
Dim s As Series = New Series("Series " & a.ToString())
For b = 1 To c - 1
Dim e As Element = New Element("Element " & b.ToString())
e.YValue = myR.Next(50)
s.Elements.Add(e)
Next b
SC.Add(s)
Next a
Return SC
End Function
Function getLiveData() As SeriesCollection
Dim de As DataEngine = New DataEngine("ConnectionString goes here")
de.ChartObject = Chart ' Necessary to view any errors the dataEngine may throw.
de.SqlStatement = "SELECT XAxisColumn, YAxisColumn FROM ...."
Return de.GetSeries()
End Function
</script>
<html xmlns="http://www.w3.org/1999/xhtml">
<head>
<title>.netCHARTING Sample</title>
</head>
<body>
<div align="center">
<dotnet:Chart ID="Chart" runat="server" />
</div>
</body>
</html>