// Set up the chart Chart.Type = ChartType.Gauges;//Horizontal; Chart.Width = 500; Chart.Height = 350; Chart.TempDirectory = "temp"; Chart.Debug = true; Chart.LegendBox.Position = LegendBoxPosition.None; Chart.DefaultAxis.Label.Font = new Font("Arial",9);
// Demonstrates how to manipulate gauge axis orientation and sweep angles.
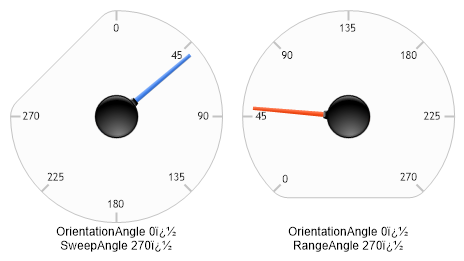
// Create a series with an element. Series s = new Series("OrientationAngle \t0�\nSweepAngle \t270�", new Element("",50));
// Update settings for the main y axis. Axis a = Chart.YAxis; // Set the orientation angle to 0. ( Pointing up ) a.OrientationAngle = 0; a.SweepAngle = 270; a.Maximum = 270; a.Interval = 45;
// Create another series with an element. Series s2 = new Series("OrientationAngle \t0�\nRangeAngle \t270�", new Element("",50));
// In order for the gauge axes to behave differently, we need to use 2 different axes. // Create a new axis for the second series. Axis a2 = new Axis(); s2.YAxis = a2; a2.OrientationAngle = 0; a2.RangeAngle = 270; a2.Maximum = 270; a2.Interval = 45;
// Add the random data. Chart.SeriesCollection.Add(s); Chart.SeriesCollection.Add(s2);
Sub Page_Load(ByVal sender As Object, ByVal e As EventArgs)
' Set up the chart Chart.Type = ChartType.Gauges 'Horizontal; Chart.Width = 500 Chart.Height = 350 Chart.TempDirectory = "temp" Chart.Debug = True Chart.LegendBox.Position = LegendBoxPosition.None Chart.DefaultAxis.Label.Font = New Font("Arial",9)
' Demonstrates how to manipulate gauge axis orientation and sweep angles.
' Create a series with an element. Dim s As Series = New Series("OrientationAngle " & Constants.vbTab & "0�" & Constants.vbLf & "SweepAngle " & Constants.vbTab & "270�", New Element("",50))
' Update settings for the main y axis. Dim a As Axis = Chart.YAxis ' Set the orientation angle to 0. ( Pointing up ) a.OrientationAngle = 0 a.SweepAngle = 270 a.Maximum = 270 a.Interval = 45
' Create another series with an element. Dim s2 As Series = New Series("OrientationAngle " & Constants.vbTab & "0�" & Constants.vbLf & "RangeAngle " & Constants.vbTab & "270�", New Element("",50))
' In order for the gauge axes to behave differently, we need to use 2 different axes. ' Create a new axis for the second series. Dim a2 As Axis = New Axis() s2.YAxis = a2 a2.OrientationAngle = 0 a2.RangeAngle = 270 a2.Maximum = 270 a2.Interval = 45
' Add the random data. Chart.SeriesCollection.Add(s) Chart.SeriesCollection.Add(s2)