Gallery
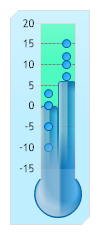
Gauge Thermometer Styled
<%@ Page Language="C#" Description="dotnetCHARTING Component" %>
<%@ Register TagPrefix="dotnet" Namespace="dotnetCHARTING" Assembly="dotnetCHARTING" %>
<%@ Import Namespace="System.Drawing" %>
<%@ Import Namespace="System.Drawing.Drawing2D" %>
<%@ Import Namespace="dotnetCHARTING.Mapping" %>
<script runat="server">
void Page_Load(Object sender, EventArgs e)
{
// Demonstrates a vertical thermometer gauge using shading effect two and sub values.
Chart.Size = "110x220";
Chart.TempDirectory = "temp";
Chart.Debug = true;
Chart.Palette = new Color[] { Color.FromArgb(0, 156, 255) };
Chart.LegendBox.Visible = false;
Chart.DefaultSeries.GaugeLinearStyle = GaugeLinearStyle.Thermometer;
Chart.Type = ChartType.Gauges;
Chart.DefaultSeries.GaugeType = GaugeType.Vertical;
Chart.ShadingEffectMode = ShadingEffectMode.Two;
Chart.ChartArea.Padding = 4;
Chart.Margin = "-2";
Chart.ChartArea.ClearColors();
Chart.YAxis.DefaultTick.GridLine.Color = Color.Gray;
Chart.YAxis.DefaultTick.GridLine.DashStyle = DashStyle.Dash;
Chart.DefaultElement.DefaultSubValue.Type = SubValueType.Marker;
Chart.DefaultElement.Transparency = 20;
Chart.DefaultSeries.GaugeBorderBox.CornerTopLeft = BoxCorner.Cut;
Chart.DefaultSeries.GaugeBorderBox.CornerBottomRight = BoxCorner.Cut;
Chart.DefaultSeries.GaugeBorderShape = GaugeBorderShape.UseBox;
Chart.DefaultSeries.GaugeBorderBox.Background.Color = Color.FromArgb(77, 251, 192);
Chart.DefaultSeries.Background.Color = Color.FromArgb(191, 238, 255);
// *DYNAMIC DATA NOTE*
// This sample uses random data to populate the chart. To populate
// a chart with database data see the following resources:
// - Help File > Getting Started > Data Tutorials
// - DataEngine Class in the help file
// - Sample: features/DataEngine.aspx
SeriesCollection mySC = getRandomData();
// Add the random data.
Chart.SeriesCollection.Add(mySC);
}
SeriesCollection getRandomData()
{
Random myR = new Random();
SeriesCollection SC = new SeriesCollection();
for (int a = 1; a < 2; a++)
{
Series s = new Series("");
for (int b = 1; b < 3; b++)
{
Element e = new Element("Element " + b.ToString());
e.YValue = myR.Next(50);
for(int i = 0;i <4;i++)
e.SubValues.Add(SubValue.FromValue(e.YValue + (-10+myR.Next(20))));
s.Elements.Add(e);
}
SC.Add(s);
}
return SC;
}
</script>
<html xmlns="http://www.w3.org/1999/xhtml">
<head>
<title>.netCHARTING Sample</title>
</head>
<body>
<div align="center">
<dotnet:Chart ID="Chart" runat="server" />
</div>
</body>
</html>
<%@ Page Language="vb" Description="dotnetCHARTING Component" %>
<%@ Register TagPrefix="dotnet" Namespace="dotnetCHARTING" Assembly="dotnetCHARTING" %>
<%@ Import Namespace="System.Drawing" %>
<%@ Import Namespace="System.Drawing.Drawing2D" %>
<%@ Import Namespace="dotnetCHARTING.Mapping" %>
<script runat="server">
Sub Page_Load(ByVal sender As Object, ByVal e As EventArgs)
' Demonstrates a vertical thermometer gauge using shading effect two and sub values.
Chart.Size = "110x220"
Chart.TempDirectory = "temp"
Chart.Debug = True
Chart.Palette = New Color() { Color.FromArgb(0, 156, 255) }
Chart.LegendBox.Visible = False
Chart.DefaultSeries.GaugeLinearStyle = GaugeLinearStyle.Thermometer
Chart.Type = ChartType.Gauges
Chart.DefaultSeries.GaugeType = GaugeType.Vertical
Chart.ShadingEffectMode = ShadingEffectMode.Two
Chart.ChartArea.Padding = 4
Chart.Margin = "-2"
Chart.ChartArea.ClearColors()
Chart.YAxis.DefaultTick.GridLine.Color = Color.Gray
Chart.YAxis.DefaultTick.GridLine.DashStyle = DashStyle.Dash
Chart.DefaultElement.DefaultSubValue.Type = SubValueType.Marker
Chart.DefaultElement.Transparency = 20
Chart.DefaultSeries.GaugeBorderBox.CornerTopLeft = BoxCorner.Cut
Chart.DefaultSeries.GaugeBorderBox.CornerBottomRight = BoxCorner.Cut
Chart.DefaultSeries.GaugeBorderShape = GaugeBorderShape.UseBox
Chart.DefaultSeries.GaugeBorderBox.Background.Color = Color.FromArgb(77, 251, 192)
Chart.DefaultSeries.Background.Color = Color.FromArgb(191, 238, 255)
' *DYNAMIC DATA NOTE*
' This sample uses random data to populate the chart. To populate
' a chart with database data see the following resources:
' - Help File > Getting Started > Data Tutorials
' - DataEngine Class in the help file
' - Sample: features/DataEngine.aspx
Dim mySC As SeriesCollection = getRandomData()
' Add the random data.
Chart.SeriesCollection.Add(mySC)
End Sub
Function getRandomData() As SeriesCollection
Dim myR As Random = New Random()
Dim SC As SeriesCollection = New SeriesCollection()
For a As Integer = 1 To 1
Dim s As Series = New Series("")
For b As Integer = 1 To 2
Dim e As Element = New Element("Element " & b.ToString())
e.YValue = myR.Next(50)
For i As Integer = 0 To 3
e.SubValues.Add(SubValue.FromValue(e.YValue + (-10+myR.Next(20))))
Next i
s.Elements.Add(e)
Next b
SC.Add(s)
Next a
Return SC
End Function
</script>
<html xmlns="http://www.w3.org/1999/xhtml">
<head>
<title>.netCHARTING Sample</title>
</head>
<body>
<div align="center">
<dotnet:Chart ID="Chart" runat="server" />
</div>
</body>
</html>
- Sample FilenameGaugeThermometerStyled.aspx
- Version4.3
- Uses DatabaseNo