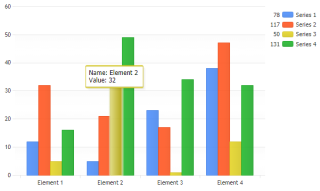
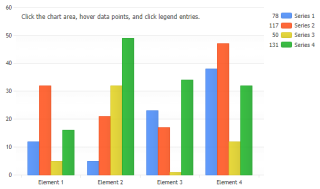
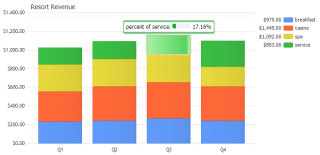
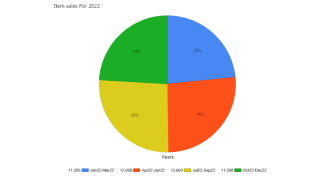
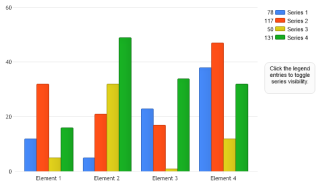
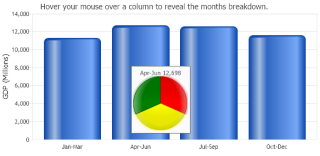
- JS Tooltip Icons
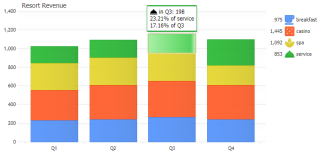
Demonstrates using icons in tooltips and legend entry icons.
- JS Deposit Calculator
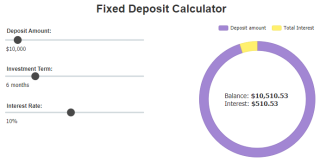
Demonstrates how to adjust pie shape elements using a slider UI controls.
- JS Icon Chart Types
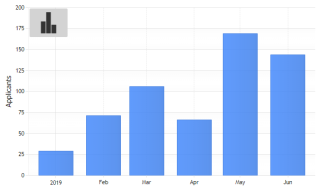
Demonstrates UI dropdown control with morphing svg icons.
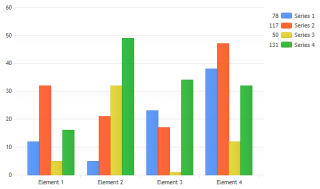
- JS Toggle Visibility
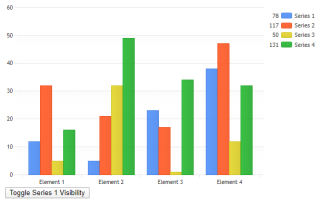
Demonstrates toggling series visibility from javascript.
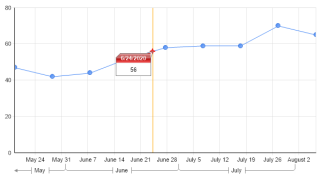
- JS Tooltips
Demonstrates using tooltips with a JSC chart.
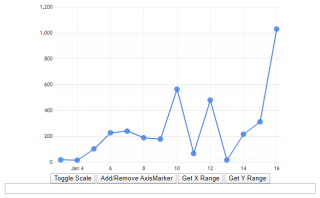
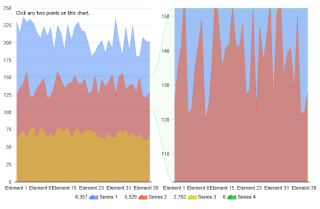
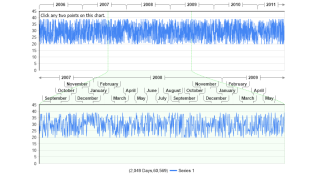
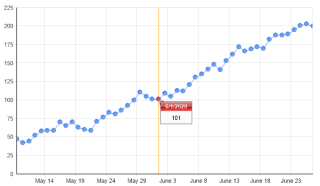
- JS Zooming
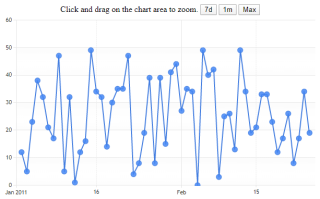
Demonstrates zooming features of JSCharting.
- JS Pie Interactive
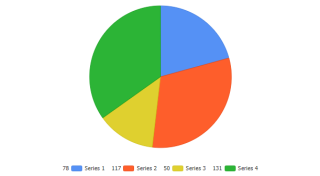
Demonstrates JSCharting pie interactivity. Click pie slices to explode them.
- JS Live Data Update
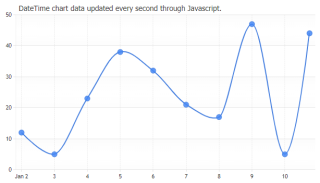
Demonstrates adding time based points to the js chart in real-time.
- JS LiveDataUpdateN
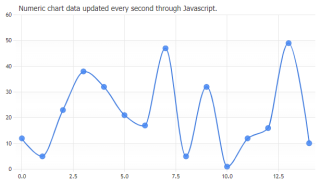
Demonstrates adding numeric points to the js chart in real-time.
- JS Dynamic Styling Updates
Demonstrates manipulating the chart in real-time through Javascript.
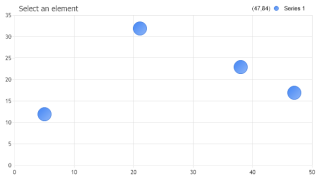
- JS ElementURL
Demonstrates a javascript chart with clickable elements.
- JS Click Add Point
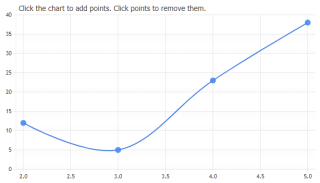
Demonstrates an interactive JSC chart where points are added when clicking on the chart area.
- JS Events
Demonstrates wiring up JS event function handlers to chart objects.
- JS Axis Tick Angles Slider
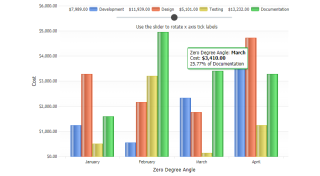
Demonstrates using angled x axis ticks on a JSC chart.
- JS Pie Shape Slider
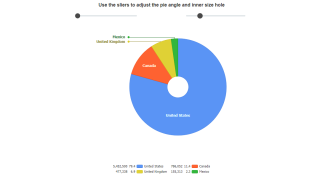
Demonstrates specifying starting angles for pies with JSC Charts.
- JS Tooltip Crosshair Columns
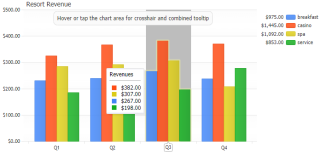
Demonstrates Column series type with x axis crosshair using column width grid line.
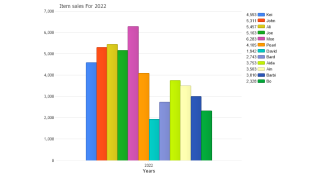
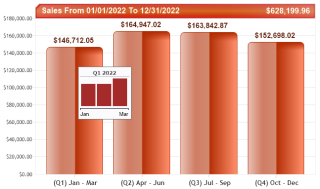
- JS Tooltip Micro
Demonstrates using micro chart in tooltips
- Drilldown
Demonstrates the power of automated drilldown using only the DrillDownChain property.
- Drilldown Manual
Demonstrates how a drill down can be performed manually with enhanced flexibility.
- Drilldown Multi Series
Demonstrates drilldown with multiple series and show a single series through the drill down chain.
- Drilldown Multi Series 2

Demonstrates drilldown with multiple series and show all the series through the drill down chain.
- Drill Down No Date Grouping
Demonstrates how a drill down can be performed without date grouping.
- Drilldown Other Element
Demonstrates drilldown in other element when limit is set.
- DrilldownOtherElementDE
Demonstrates drilldown in other element when limit is set using the DataEngine.
- Drilldown Other Series

Demonstrates drilldown in other series when SplitByLimit is set.
- DrilldownOtherSeriesDE
Demonstrates drilldown in other series when SplitByLimit is set using the DataEngine.
- Drilldown Pie
Demonstrates drilldown with a pie chart.
- Drilldown Split By
Demonstrates drilldown using the SplitBy option.
- Drill Slice
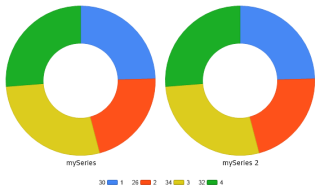
Demonstrates using drill down to explode a donut slice when clicked.
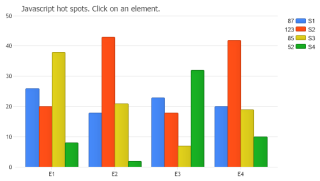
- Hotspots

Demonstrates how to use hotspots.
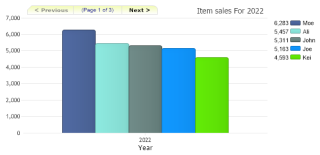
- Paging Elements
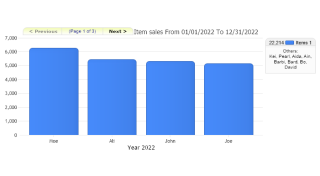
Demonstrates how to setup an interface to page through multiple elements in a single series.
- Paging Series
Demonstrates how to setup an interface to page through multiple series using annotations as navigation buttons.
- Javascript Click
Use javascript in the url of elements on a chart.
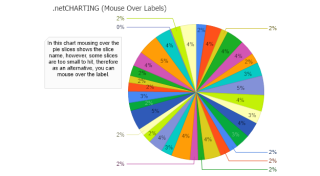
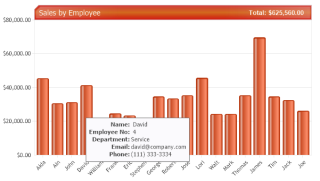
- Java Script Tool Tips
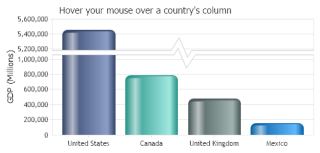
Demonstrates how to implement JavaScript tool tips with custom formatting and inline images returned from element level custom attributes replaced dynamically in a custom hotspot OnMouseOver HTML attribute.
- Axis Value From Click
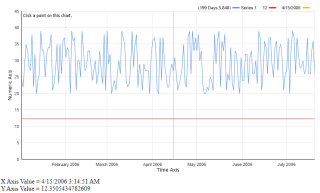
Demonstrates getting the value of an axis when the chart is clicked.
- YAxis Zoom
Demonstrates an interactive way to zoom a section of an axis.
- XAxis Zoom
Demonstrates an interactive way to zoom a section of an axis.
- Label Hotspots
Demonstrates using hotspots on labels.
- Tabbed Series
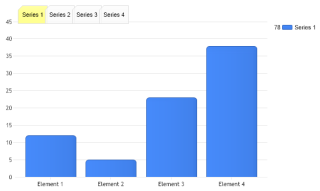
Demonstrates showing series individually by clickable tabs.
- Hide Series
Demonstrates making series invisible based on a legend entry click.
- Click Point Interpolated Value
Demonstrates using Series.GetInterpolated_Value() to find midpoints between two elements.
- Click Point Line Value
Demonstrates finding the closest point to where the chart is clicked.
- Move Data
Demonstrates using multiple image map techniques on a single chart.
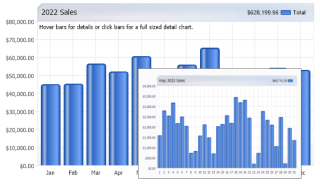
- Js Tool Tip Chart
Demonstrates using a dynamic chart inside tooltips.
- Propagate States
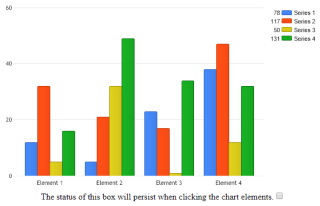
Demonstrates clicking on a chart element while preserving the status of other controls on the page.
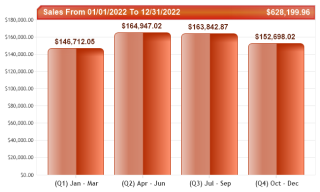
- Rich Tooltips
Demonstrates using infoGrids in tooltips to show styled element details.
- Drill Down Preview
Demonstrates manual drilldown with previews using microCharts and subValues.
- Drill Down Preview 2
Demonstrates manual drilldown with previews using the same chart page.
- Full Chart Tooltips DB Grouping
Demonstrates showing this chart in tooltips of each element and based on SubValues created using the Series.SplitRegroupCalculate Method.
- Org Expansion
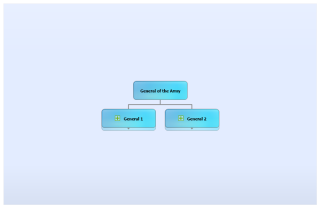
Demonstrates interactive organizational chart expansion using the AJAX zoomer.
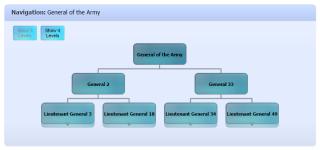
- Org Db Rich Tooltips
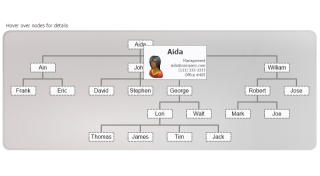
Demonstrates making a simple tree organizational chart using the DB and with rich tooltips detailing each node.
- Org Drill Down
Demonstrates organizational drill-down using the Series.