// Demonstrates how Gauge backgrounds can be used.
// First create a series, if you would like to get the data from a database you need to use // the data engine. See sample: features/dataEngine.aspx. Or the dataEngine tutorial in the help file. Series s = new Series();
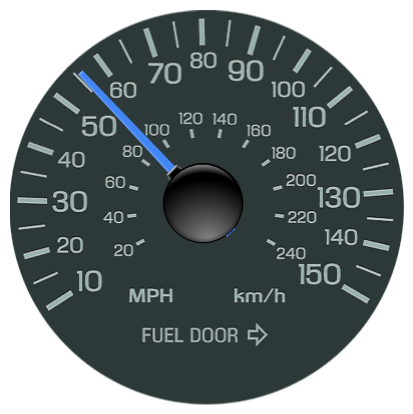
// Turn off gauge clipping so the gauge is a complete circle to match our image. Chart.ClipGauges = false;
s.Background.Color = Color.Transparent; // Add an element s.Elements.Add(new Element("",55));
// Update the main y axis settings to match the ticks in our image. Axis a = Chart.YAxis;
<%@ Page Language="vb" Description="dotnetCHARTING Component" %> <%@ Register TagPrefix="dotnet" Namespace="dotnetCHARTING" Assembly="dotnetCHARTING"%> <%@ Import Namespace="System.Drawing" %> <html xmlns="http://www.w3.org/1999/xhtml"> <head> <title>.netCHARTING Sample</title> <script runat="server"> Sub Page_Load(ByVal sender As Object, ByVal e As EventArgs) Chart.Type = ChartType.Gauges 'Horizontal; Chart.Width = 420 Chart.Height = 420 Chart.TempDirectory = "temp" Chart.Debug = True Chart.ChartArea.ClearColors() ' Set the background for chart area Chart.ChartArea.Background.ImagePath = "../../images/gauge.gif"
Chart.LegendBox.Position = LegendBoxPosition.None
' Demonstrates how Gauge backgrounds can be used.
' First create a series, if you would like to get the data from a database you need to use ' the data engine. See sample: features/dataEngine.aspx. Or the dataEngine tutorial in the help file. Dim s As Series = New Series()
' Turn off gauge clipping so the gauge is a complete circle to match our image. Chart.ClipGauges = False
s.Background.Color = Color.Transparent ' Add an element s.Elements.Add(New Element("",55))
' Update the main y axis settings to match the ticks in our image. Dim a As Axis = Chart.YAxis