void Page_Load(Object sender, EventArgs e) { // Demonstrates specifying a rectangle where the gauge will render.
Chart.TempDirectory = "temp"; Chart.Debug = true;
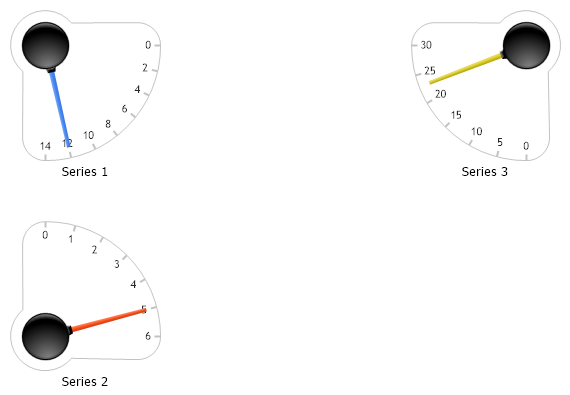
Chart.Type = ChartType.Gauges; Chart.Size = "600x450"; //Chart.Title = ".netCHARTING Sample"; Chart.LegendBox.Visible = false; Chart.DefaultAxis.DefaultTick.Line.Length = 6; Chart.DefaultAxis.SweepAngle = 90; Chart.DefaultSeries.GaugeBorderBox.Background.Color = Color.White; Chart.Background.Color = Color.FromArgb(20, 250, 250, 250); // *DYNAMIC DATA NOTE* // This sample uses random data to populate the chart. To populate // a chart with database data see the following resources: // - Use the getLiveData() method using the dataEngine to query a database. // - Help File > Getting Started > Data Tutorials // - DataEngine Class in the help file // - Sample: features/DataEngine.aspx
SeriesCollection mySC = getRandomData(); mySC[0].YAxis = new Axis(); mySC[1].YAxis = new Axis(); mySC[2].YAxis = new Axis(); mySC[0].YAxis.OrientationAngle = 90; mySC[2].YAxis.OrientationAngle = 180; mySC[2].YAxis.Interval = 5; mySC[0].GaugeBorderBox.Position = new Rectangle(new Point(20, 50), new Size(150, 150)); mySC[1].GaugeBorderBox.Position = new Rectangle(new Point(20, 260), new Size(150, 150)); mySC[2].GaugeBorderBox.Position = new Rectangle(new Point(420, 50), new Size(150, 150));
// Add the random data. Chart.SeriesCollection.Add(mySC); }
SeriesCollection getRandomData() { Random myR = new Random(1); SeriesCollection SC = new SeriesCollection(); int a = 0; int b = 0; for (a = 1; a < 4; a++) { Series s = new Series("Series " + a.ToString()); for (b = 1; b < 2; b++) { Element e = new Element("Element " + b.ToString()); e.YValue = myR.Next(50); s.Elements.Add(e); } SC.Add(s); } return SC; }
SeriesCollection getLiveData() { DataEngine de = new DataEngine("ConnectionString goes here"); de.ChartObject = Chart; // Necessary to view any errors the dataEngine may throw. de.SqlStatement = "SELECT XAxisColumn, YAxisColumn FROM ...."; return de.GetSeries(); }
Sub Page_Load(ByVal sender As Object, ByVal e As EventArgs) ' Demonstrates specifying a rectangle where the gauge will render.
Chart.TempDirectory = "temp" Chart.Debug = True
Chart.Type = ChartType.Gauges Chart.Size = "600x450" 'Chart.Title = ".netCHARTING Sample"; Chart.LegendBox.Visible = False Chart.DefaultAxis.DefaultTick.Line.Length = 6 Chart.DefaultAxis.SweepAngle = 90 Chart.DefaultSeries.GaugeBorderBox.Background.Color = Color.White Chart.Background.Color = Color.FromArgb(20, 250, 250, 250) ' *DYNAMIC DATA NOTE* ' This sample uses random data to populate the chart. To populate ' a chart with database data see the following resources: ' - Use the getLiveData() method using the dataEngine to query a database. ' - Help File > Getting Started > Data Tutorials ' - DataEngine Class in the help file ' - Sample: features/DataEngine.aspx
Dim mySC As SeriesCollection = getRandomData() mySC(0).YAxis = New Axis() mySC(1).YAxis = New Axis() mySC(2).YAxis = New Axis() mySC(0).YAxis.OrientationAngle = 90 mySC(2).YAxis.OrientationAngle = 180 mySC(2).YAxis.Interval = 5 mySC(0).GaugeBorderBox.Position = New Rectangle(New Point(20, 50), New Size(150, 150)) mySC(1).GaugeBorderBox.Position = New Rectangle(New Point(20, 260), New Size(150, 150)) mySC(2).GaugeBorderBox.Position = New Rectangle(New Point(420, 50), New Size(150, 150))
' Add the random data. Chart.SeriesCollection.Add(mySC) End Sub
Function getRandomData() As SeriesCollection Dim myR As Random = New Random(1) Dim SC As SeriesCollection = New SeriesCollection() Dim a As Integer = 0 Dim b As Integer = 0 For a = 1 To 3 Dim s As Series = New Series("Series " & a.ToString()) For b = 1 To 1 Dim e As Element = New Element("Element " & b.ToString()) e.YValue = myR.Next(50) s.Elements.Add(e) Next b SC.Add(s) Next a Return SC End Function
Function getLiveData() As SeriesCollection Dim de As DataEngine = New DataEngine("ConnectionString goes here") de.ChartObject = Chart ' Necessary to view any errors the dataEngine may throw. de.SqlStatement = "SELECT XAxisColumn, YAxisColumn FROM ...." Return de.GetSeries() End Function