Gauge Styling
Some gauge styling methods.
<%@ Page Language="C#" Description="dotnetCHARTING Component" %>
<%@ Register TagPrefix="dotnet" Namespace="dotnetCHARTING" Assembly="dotnetCHARTING"%>
<%@ Import Namespace="System.Drawing" %>
<%@ Import Namespace="System.Drawing.Drawing2D" %>
<html xmlns="http://www.w3.org/1999/xhtml">
<head>
<title>.netCHARTING Sample</title>
<script runat="server">
void Page_Load(Object sender,EventArgs e)
{
// Set common properties for each shart.
SetChartProperties(Chart);
SetChartProperties(Chart1);
SetChartProperties(Chart2);
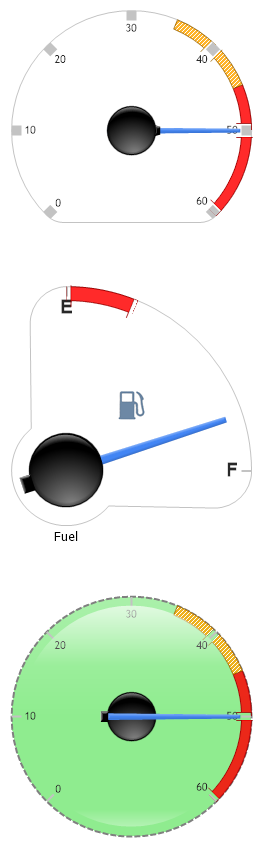
// Demonstrates some gauge styling methods.
// Setting the shading mode changes how the needle appears.
Chart.ShadingEffectMode = ShadingEffectMode.One;
Chart1.ShadingEffectMode = ShadingEffectMode.Two;
Chart2.ShadingEffectMode = ShadingEffectMode.Three;
// CHART 1
// Style the first chart's axis tick marks.
Chart.YAxis.DefaultTick.Line.Width = 10;
Chart.YAxis.DefaultTick.Line.EndCap = LineCap.Triangle;
// Add an element.
Chart.SeriesCollection.Add(new Series("",new Element("",50)));
// CHART 2
// Set a label marker
Chart1.YAxis.LabelMarker = new ElementMarker("../../Images/fuel.gif",30);
// Update the main y axis settings
Chart1.YAxis.Minimum = 0;
Chart1.YAxis.Maximum = 100;
Chart1.YAxis.Interval = 25;
Chart1.YAxis.OrientationAngle = 45;
Chart1.YAxis.RangeAngle = 90;
// Fuel tick labels
Chart1.YAxis.LabelOverrides.Add( new LabelOverride("0","E"));
Chart1.YAxis.LabelOverrides.Add( new LabelOverride("100","F"));
Chart1.YAxis.ClearValues = true;
Chart1.YAxis.Markers.Clear();
Chart1.YAxis.Markers.Add( new AxisMarker("",new Background(Color.Red),0,25) );
Chart1.YAxis.DefaultTick.Label.Font = new Font("Arial",14,FontStyle.Bold);
// Add an element.
Chart1.SeriesCollection.Add(new Series("Fuel",new Element("",80)));
// CHART 3
Chart2.DefaultSeries.Background.Color = Color.LightGreen;
// Change the gauge outline.
Chart2.YAxis.Line.Width = 2;
Chart2.YAxis.Line.DashStyle = DashStyle.Dash;
Chart2.YAxis.Line.Color = Color.Gray;
// When gauges are not clipped and Use3D is true, the gauge is accented with a glass effect.
Chart2.ClipGauges = false;
Chart2.Use3D = true;
// Add an element.
Chart2.SeriesCollection.Add(new Series("",new Element("",50)));
}
void SetChartProperties(Chart c)
{
c.Type = ChartType.Gauges;
c.Width = 300;
c.Height = 300;
c.TempDirectory = "temp";
c.Debug = true;
c.LegendBox.Position = LegendBoxPosition.None;
c.DefaultSeries.Background.Color = Color.White;
AxisMarker am = new AxisMarker("",new Background(Color.Red),45,60);
Background bg = new Background(Color.Orange);
bg.HatchStyle = HatchStyle.LightUpwardDiagonal;
bg.HatchColor = Color.White;
AxisMarker am1 = new AxisMarker("",bg,35,45);
c.YAxis.Markers.Add(am);
c.YAxis.Markers.Add(am1);
}
</script>
</head>
<body>
<div style="text-align:center">
<dotnet:Chart id="Chart" runat="server" Width="568px" Height="344px">
</dotnet:Chart>
<dotnet:Chart id="Chart1" runat="server" Width="568px" Height="344px">
</dotnet:Chart>
<dotnet:Chart id="Chart2" runat="server" Width="568px" Height="344px">
</dotnet:Chart>
</div>
</body>
</html>
<%@ Page Language="vb" Description="dotnetCHARTING Component" %>
<%@ Register TagPrefix="dotnet" Namespace="dotnetCHARTING" Assembly="dotnetCHARTING"%>
<%@ Import Namespace="System.Drawing" %>
<%@ Import Namespace="System.Drawing.Drawing2D" %>
<html xmlns="http://www.w3.org/1999/xhtml">
<head>
<title>.netCHARTING Sample</title>
<script runat="server">
Sub Page_Load(ByVal sender As Object, ByVal e As EventArgs)
' Set common properties for each shart.
SetChartProperties(Chart)
SetChartProperties(Chart1)
SetChartProperties(Chart2)
' Demonstrates some gauge styling methods.
' Setting the shading mode changes how the needle appears.
Chart.ShadingEffectMode = ShadingEffectMode.One
Chart1.ShadingEffectMode = ShadingEffectMode.Two
Chart2.ShadingEffectMode = ShadingEffectMode.Three
' CHART 1
' Style the first chart's axis tick marks.
Chart.YAxis.DefaultTick.Line.Width = 10
Chart.YAxis.DefaultTick.Line.EndCap = LineCap.Triangle
' Add an element.
Chart.SeriesCollection.Add(New Series("",New Element("",50)))
' CHART 2
' Set a label marker
Chart1.YAxis.LabelMarker = New ElementMarker("../../Images/fuel.gif",30)
' Update the main y axis settings
Chart1.YAxis.Minimum = 0
Chart1.YAxis.Maximum = 100
Chart1.YAxis.Interval = 25
Chart1.YAxis.OrientationAngle = 45
Chart1.YAxis.RangeAngle = 90
' Fuel tick labels
Chart1.YAxis.LabelOverrides.Add(New LabelOverride("0","E"))
Chart1.YAxis.LabelOverrides.Add(New LabelOverride("100","F"))
Chart1.YAxis.ClearValues = True
Chart1.YAxis.Markers.Clear()
Chart1.YAxis.Markers.Add(New AxisMarker("",New Background(Color.Red),0,25))
Chart1.YAxis.DefaultTick.Label.Font = New Font("Arial",14,FontStyle.Bold)
' Add an element.
Chart1.SeriesCollection.Add(New Series("Fuel",New Element("",80)))
' CHART 3
Chart2.DefaultSeries.Background.Color = Color.LightGreen
' Change the gauge outline.
Chart2.YAxis.Line.Width = 2
Chart2.YAxis.Line.DashStyle = DashStyle.Dash
Chart2.YAxis.Line.Color = Color.Gray
' When gauges are not clipped and Use3D is true, the gauge is accented with a glass effect.
Chart2.ClipGauges = False
Chart2.Use3D = True
' Add an element.
Chart2.SeriesCollection.Add(New Series("",New Element("",50)))
End Sub
Sub SetChartProperties(ByVal c As Chart)
c.Type = ChartType.Gauges
c.Width = 300
c.Height = 300
c.TempDirectory = "temp"
c.Debug = True
c.LegendBox.Position = LegendBoxPosition.None
c.DefaultSeries.Background.Color = Color.White
Dim am As AxisMarker = New AxisMarker("",New Background(Color.Red),45,60)
Dim bg As Background = New Background(Color.Orange)
bg.HatchStyle = HatchStyle.LightUpwardDiagonal
bg.HatchColor = Color.White
Dim am1 As AxisMarker = New AxisMarker("",bg,35,45)
c.YAxis.Markers.Add(am)
c.YAxis.Markers.Add(am1)
End Sub
</script>
</head>
<body>
<div style="text-align:center">
<dotnet:Chart id="Chart" runat="server" Width="568px" Height="344px">
</dotnet:Chart>
<dotnet:Chart id="Chart1" runat="server" Width="568px" Height="344px">
</dotnet:Chart>
<dotnet:Chart id="Chart2" runat="server" Width="568px" Height="344px">
</dotnet:Chart>
</div>
</body>
</html>