- JS Tires Compared
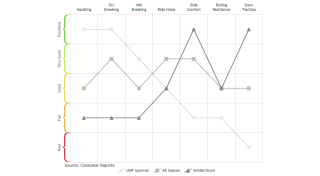
Demonstrates custom curly brace range ticks mapped to tire ratings.
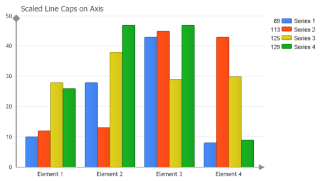
- JS Axis Line Caps
Demonstrates arrow and circle axis line caps.
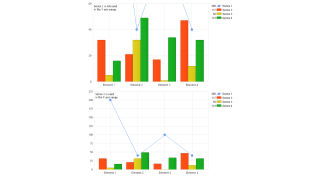
- JS Axis Quarter Groups
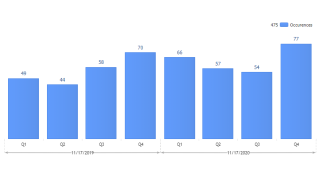
This sample deomonstrates custom calendar pattern axis ranges.
- JS Axis Line Breaks
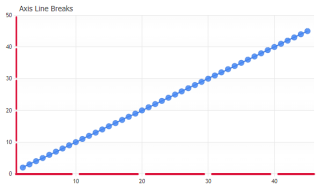
Demonstrates using axis line breaks at tick positions.
- JS Multiple Axes
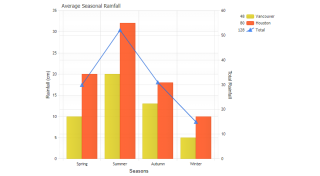
Demonstrates using multiple axes with JSCharting.
- JS Inverted Axis
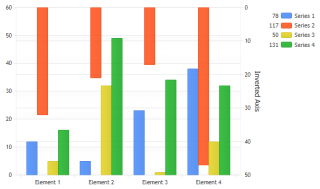
Demonstrates using an inverted axis with a JSC chart.
- JS Axis Click Value
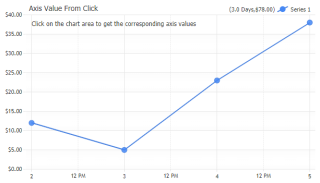
Demonstrates how to programatically get the axis value positions when the chart area is clicked.
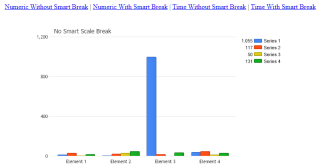
- JS Axis Scale Breaks
Demonstrates using automatic scale breaks in a JS chart.Chart.
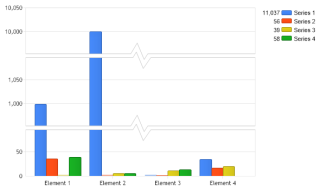
- JS Axis Scale Breaks Manual
Demonstrates adding scale breaks manually to a JS chart.
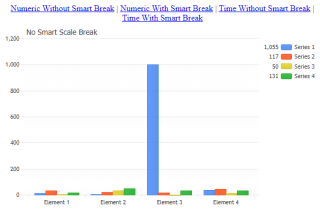
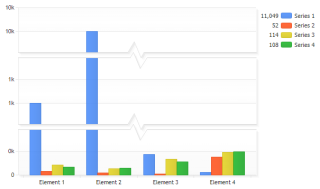
- JS Smart Scale Break Limit
Demonstrates limiting the number of breaks the smart scale break feature creates in JSC.
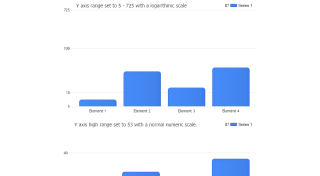
- JS Axis Log Scale
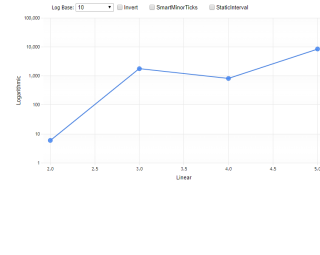
Demonstrates using logarithmic scale with JSCharting.
- Axis Caps
Axis line caps.
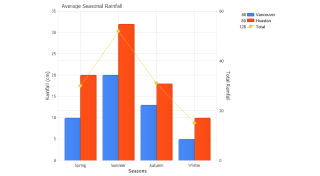
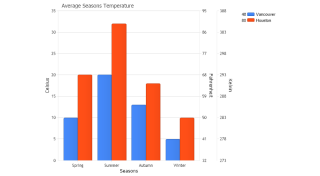
- Axis Dual Scales
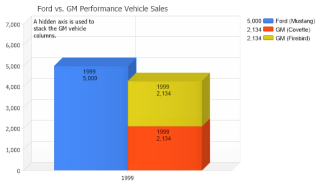
Use a second y axis to show a different scale.
- Axis Grid Line Per Tick
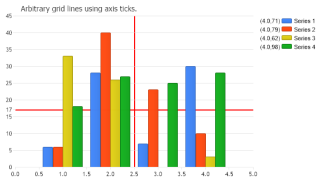
How additional grid lines on a chart area at any position using axis ticks.
- Axis Minimum Interval
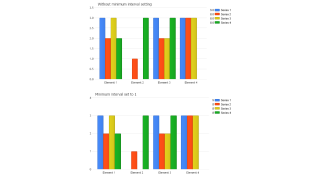
How minimum intervals can be used.
- Axis Orientation
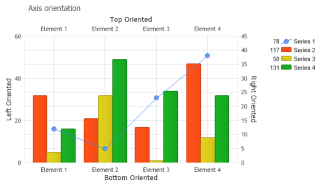
The different positions axes can be oriented.
- Axis Scale Breaks
Demonstrates using automatic scale breaks with numeric and time axes.
- Axis Scale Breaks Manual
Demonstrates adding scale breaks manually.
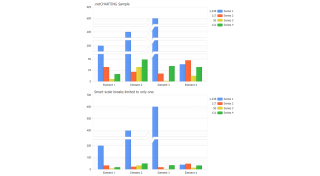
- Smart Scale Break Limit
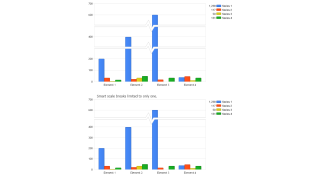
Demonstrates limiting the number of breaks the smart scale break feature creates.
- Axis Scale Range
How scale ranges can be set.
- Axis Scale Synchronization
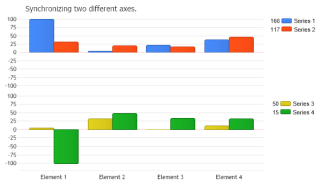
Demonstrates how to synchronize two axis scales.
- Affecting Ranges
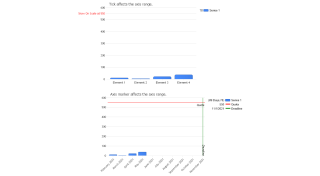
How axis ticks and axis markers can force an axis scale to expand so they can be seen.
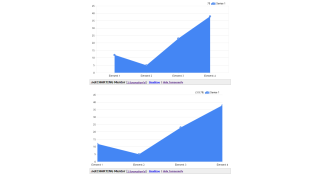
- Calculated Time Axis
Use calculated time axes.
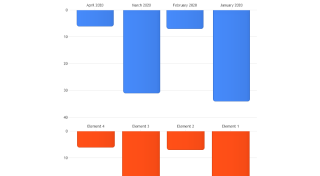
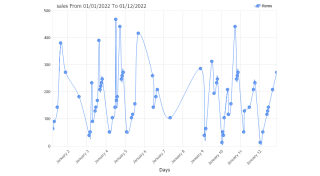
- Calendar Pattern
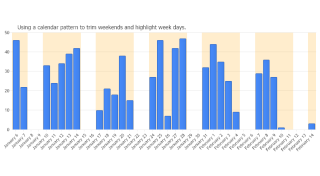
How a calendar pattern can be used to trim data and highlight chart area sections.
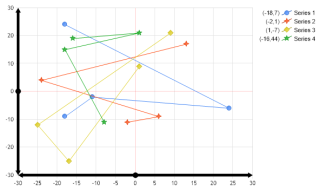
- Inverted Axis
This sample will demonstratate how to invert the axis scales.
- Invisible Axis
Demonstrates making the original axis invisible and adding a new axis to replace it while maintaining series bindings to both axis.
- Series Axis Binding
Demonstrates binding multiple series to one axis and a derived series to a secondary axis.
- Series Axis Bindingdb
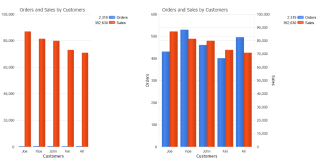
Shows total sales and number of orders from the sample database bound to different axis and also shows how the same chart would appear if bound to the same axis.
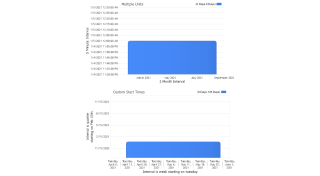
- Time Interval
Shows a calculated time axis changing the time interval without altering the rendered chart.
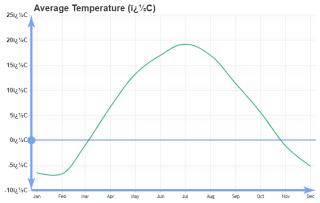
- Unitconversion
Demonstrates using the built in axis calculation to convert units and add multiple temperature axis.
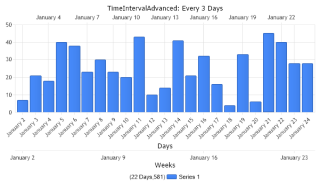
- Advanced Time Interval
Use the advanced TimeInterval features with axis scales.
- Scale Break Calendar Pattern
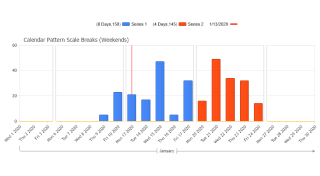
Demonstrates using automatic scale break with calendar pattern.
- Scale Break Styling
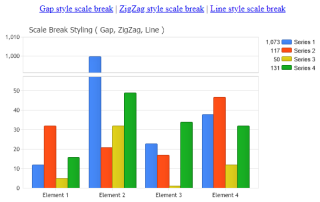
Demonstrates different scale break styles: Gap, ZigZag and Line.
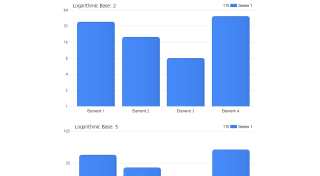
- Axis Log Bases
Using log scales with different logarithmic bases.
- Axis Scale Log Range
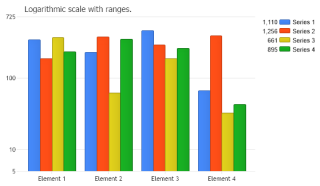
Setting an axis range with the logarithmic scale.
- Get Axis Range
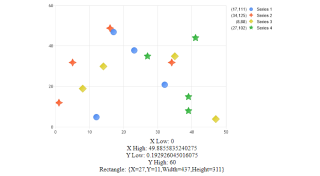
Demonstrates getting the dynamically determined axis ranges.
- Line Cap Scale
Manipulate line cap scales.
- Exclude Series Range
Demonstrates excluding a series from the axis range.
- Axis Range In Scale
Demonstrates using an axis marker with IncludeInAxisScale set to true. The axis min/max snap to the marker range automatically.
- Percent Axis
Demonstrates how an axis showing the percent of the data's maximum value can be added.
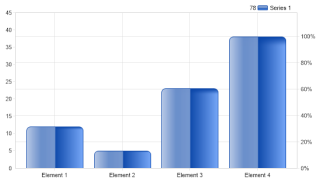
- Category Scale Stretch
Demonstrates how a category scale series can be stretched to edges horizontally.