Gallery
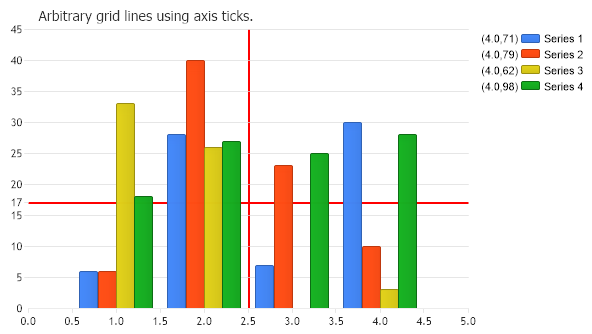
Axis Grid Line Per Tick
<%@ Page Language="C#" Description="dotnetCHARTING Component" %>
<%@ Register TagPrefix="dotnet" Namespace="dotnetCHARTING" Assembly="dotnetCHARTING"%>
<%@ Import Namespace="System.Drawing" %>
<html xmlns="http://www.w3.org/1999/xhtml">
<head>
<title>.netCHARTING Sample</title>
<script runat="server">
void Page_Load(Object sender,EventArgs e)
{
Chart.Type = ChartType.Combo;
Chart.Width = 600;
Chart.Height = 350;
Chart.TempDirectory = "temp";
Chart.Debug = true;
Chart.Title = "Arbitrary grid lines using axis ticks.";
// * INTRO *
// Demonstrates how additional grid lines on a chart area at any position using axis ticks.
// 1. CREATE TICK MARKS AND ADD THEM TO THE AXES
AxisTick at = new AxisTick(17);
at.GridLine = new Line(Color.Red,2);
Chart.YAxis.ExtraTicks.Add(at);
AxisTick at2 = new AxisTick(2.5);
at2.GridLine = new Line(Color.Red,2);
Chart.XAxis.ExtraTicks.Add(at2);
// 2. ADD DATA
// *DYNAMIC DATA NOTE*
// This sample uses random data to populate the chart. To populate
// a chart with database data see the following resources:
// - Classic samples folder
// - Help File > Data Tutorials
// - Sample: features/DataEngine.aspx
// Add the random data.
Chart.SeriesCollection.Add(getRandomData());
}
SeriesCollection getRandomData()
{
SeriesCollection SC = new SeriesCollection();
Random myR = new Random();
for(int a = 1; a < 5; a++)
{
Series s = new Series();
s.Name = "Series " + a;
for(int b = 1; b < 5; b++)
{
Element e = new Element();
//e.Name = "Element " + b;
e.XValue = b;
e.YValue = myR.Next(50);
s.Elements.Add(e);
}
SC.Add(s);
}
return SC;
}
</script>
</head>
<body>
<div style="text-align:center">
<dotnet:Chart id="Chart" runat="server" Width="568px" Height="344px">
</dotnet:Chart>
</div>
</body>
</html>
<%@ Page Language="vb" Description="dotnetCHARTING Component" %>
<%@ Register TagPrefix="dotnet" Namespace="dotnetCHARTING" Assembly="dotnetCHARTING"%>
<%@ Import Namespace="System.Drawing" %>
<html xmlns="http://www.w3.org/1999/xhtml">
<head>
<title>.netCHARTING Sample</title>
<script runat="server">
Sub Page_Load(ByVal sender As Object, ByVal e As EventArgs)
Chart.Type = ChartType.Combo
Chart.Width = 600
Chart.Height = 350
Chart.TempDirectory = "temp"
Chart.Debug = True
Chart.Title = "Arbitrary grid lines using axis ticks."
' * INTRO *
' Demonstrates how additional grid lines on a chart area at any position using axis ticks.
' 1. CREATE TICK MARKS AND ADD THEM TO THE AXES
Dim at As AxisTick = New AxisTick(17)
at.GridLine = New Line(Color.Red,2)
Chart.YAxis.ExtraTicks.Add(at)
Dim at2 As AxisTick = New AxisTick(2.5)
at2.GridLine = New Line(Color.Red,2)
Chart.XAxis.ExtraTicks.Add(at2)
' 2. ADD DATA
' *DYNAMIC DATA NOTE*
' This sample uses random data to populate the chart. To populate
' a chart with database data see the following resources:
' - Classic samples folder
' - Help File > Data Tutorials
' - Sample: features/DataEngine.aspx
' Add the random data.
Chart.SeriesCollection.Add(getRandomData())
End Sub
Function getRandomData() As SeriesCollection
Dim SC As SeriesCollection = New SeriesCollection()
Dim myR As Random = New Random()
For a As Integer = 1 To 4
Dim s As Series = New Series()
s.Name = "Series " & a
For b As Integer = 1 To 4
Dim e As Element = New Element()
'e.Name = "Element " + b;
e.XValue = b
e.YValue = myR.Next(50)
s.Elements.Add(e)
Next b
SC.Add(s)
Next a
Return SC
End Function
</script>
</head>
<body>
<div style="text-align:center">
<dotnet:Chart id="Chart" runat="server" Width="568px" Height="344px">
</dotnet:Chart>
</div>
</body>
</html>
- Sample FilenameAxisGridLinePerTick.aspx
- VersionLegacy (Pre 3.0)
- Uses DatabaseNo