Gallery
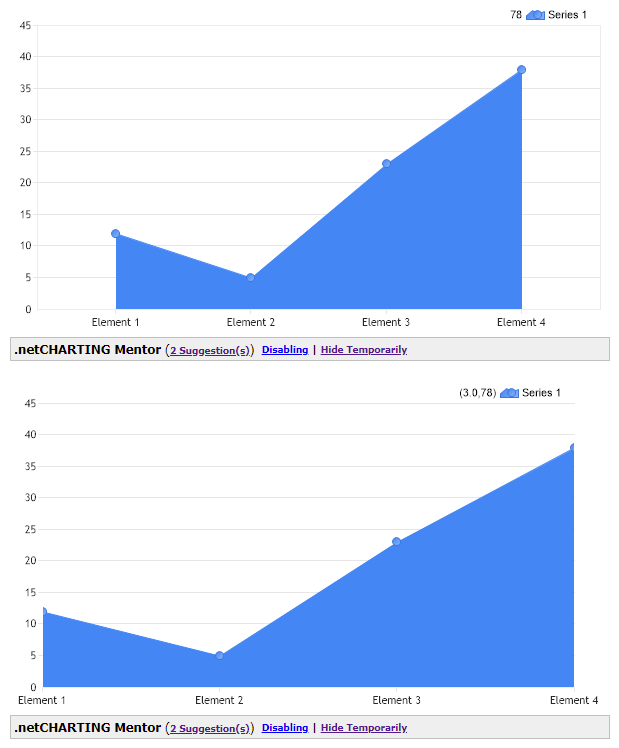
Category Scale Stretch
<%@ Page Language="C#" Description="dotnetCHARTING Component" %>
<%@ Register TagPrefix="dnc" Namespace="dotnetCHARTING" Assembly="dotnetCHARTING" %>
<%@ Import Namespace="System.Drawing" %>
<script runat="server">
void Page_Load(Object sender, EventArgs e)
{
// Demonstrates how a category scale series can be stretched to edges horizontally.
SetChart(Chart);
SetChart(Chart1);
Chart.ChartArea.Line.Color = Color.FromArgb(236, 236, 236);
Chart.ChartArea.Line.Width = 1;
// Internally this chart will use a numeric x axis scale but replace the numbers with element names.
// Get rid of the numeric ticks on the axis.
Chart1.XAxis.ClearValues = true;
int i = 0;
foreach (Element el in Chart1.SeriesCollection[0].Elements)
{
Chart1.XAxis.ExtraTicks.Add(new AxisTick(i, el.Name));
el.XValue = i;
el.Name = "";
i++;
}
Chart1.XAxis.Maximum = i-1;
}
void SetChart(Chart c) // Shared chart settings.
{
c.Type = ChartType.Combo;
c.Size = "600x350";
//c.Title = ".netCHARTING Sample";
c.TempDirectory = "temp";
c.Debug = true;
c.DefaultSeries.Type = SeriesType.AreaLine;
c.TitleBox.Position = TitleBoxPosition.FullWithLegend;
// *DYNAMIC DATA NOTE*
// This sample uses random data to populate the chart. To populate
// a chart with database data see the following resources:
// - Use the getLiveData() method using the dataEngine to query a database.
// - Help File > Getting Started > Data Tutorials
// - DataEngine Class in the help file
// - Sample: features/DataEngine.aspx
SeriesCollection mySC = getRandomData();
// Add the random data.
c.SeriesCollection.Add(mySC);
}
SeriesCollection getRandomData()
{
Random myR = new Random(1);
SeriesCollection SC = new SeriesCollection();
for (int a = 1; a < 2; a++)
{
Series s = new Series("Series " + a.ToString());
for (int b = 1; b < 5; b++)
{
Element e = new Element("Element " + b.ToString());
e.YValue = myR.Next(50);
s.Elements.Add(e);
}
SC.Add(s);
}
return SC;
}
SeriesCollection getLiveData()
{
DataEngine de = new DataEngine(ConfigurationManager.AppSettings["DNCConnectionString"]);
de.ChartObject = Chart; // Necessary to view any errors the dataEngine may throw.
de.SqlStatement = "SELECT XAxisColumn, YAxisColumn FROM ....";
return de.GetSeries();
}
</script>
<html xmlns="http://www.w3.org/1999/xhtml">
<head>
<title>.netCHARTING Sample</title>
</head>
<style type="text/css">
div, p
{
font-family: Arial, Helvetica, sans-serif;
font-size: x-small;
}
</style>
<body>
<div align="center">
<table>
<tr>
<td>
<dnc:Chart ID="Chart" runat="server" />
</td>
</tr>
<tr>
<td>
<dnc:Chart ID="Chart1" runat="server" />
</td>
</tr>
</table>
</div>
</body>
</html>
<%@ Page Language="vb" Description="dotnetCHARTING Component" %>
<%@ Register TagPrefix="dnc" Namespace="dotnetCHARTING" Assembly="dotnetCHARTING" %>
<%@ Import Namespace="System.Drawing" %>
<script runat="server">
Sub Page_Load(ByVal sender As Object, ByVal e As EventArgs)
' Demonstrates how a category scale series can be stretched to edges horizontally.
SetChart(Chart)
SetChart(Chart1)
Chart.ChartArea.Line.Color = Color.FromArgb(236, 236, 236)
Chart.ChartArea.Line.Width = 1
' Internally this chart will use a numeric x axis scale but replace the numbers with element names.
' Get rid of the numeric ticks on the axis.
Chart1.XAxis.ClearValues = True
Dim i As Integer = 0
For Each el As Element In Chart1.SeriesCollection(0).Elements
Chart1.XAxis.ExtraTicks.Add(New AxisTick(i, el.Name))
el.XValue = i
el.Name = ""
i += 1
Next el
Chart1.XAxis.Maximum = i-1
End Sub
Sub SetChart(ByVal c As Chart) ' Shared chart settings.
c.Type = ChartType.Combo
c.Size = "600x350"
'c.Title = ".netCHARTING Sample";
c.TempDirectory = "temp"
c.Debug = True
c.DefaultSeries.Type = SeriesType.AreaLine
c.TitleBox.Position = TitleBoxPosition.FullWithLegend
' *DYNAMIC DATA NOTE*
' This sample uses random data to populate the chart. To populate
' a chart with database data see the following resources:
' - Use the getLiveData() method using the dataEngine to query a database.
' - Help File > Getting Started > Data Tutorials
' - DataEngine Class in the help file
' - Sample: features/DataEngine.aspx
Dim mySC As SeriesCollection = getRandomData()
' Add the random data.
c.SeriesCollection.Add(mySC)
End Sub
Function getRandomData() As SeriesCollection
Dim myR As Random = New Random(1)
Dim SC As SeriesCollection = New SeriesCollection()
For a As Integer = 1 To 1
Dim s As Series = New Series("Series " & a.ToString())
For b As Integer = 1 To 4
Dim e As Element = New Element("Element " & b.ToString())
e.YValue = myR.Next(50)
s.Elements.Add(e)
Next b
SC.Add(s)
Next a
Return SC
End Function
Function getLiveData() As SeriesCollection
Dim de As DataEngine = New DataEngine(ConfigurationManager.AppSettings("DNCConnectionString"))
de.ChartObject = Chart ' Necessary to view any errors the dataEngine may throw.
de.SqlStatement = "SELECT XAxisColumn, YAxisColumn FROM ...."
Return de.GetSeries()
End Function
</script>
<html xmlns="http://www.w3.org/1999/xhtml">
<head>
<title>.netCHARTING Sample</title>
</head>
<style type="text/css">
div, p
{
font-family: Arial, Helvetica, sans-serif;
font-size: x-small;
}
</style>
<body>
<div align="center">
<table>
<tr>
<td>
<dnc:Chart ID="Chart" runat="server" />
</td>
</tr>
<tr>
<td>
<dnc:Chart ID="Chart1" runat="server" />
</td>
</tr>
</table>
</div>
</body>
</html>
- Sample FilenameCategoryScaleStretch.aspx
- Version6.2
- Uses DatabaseNo