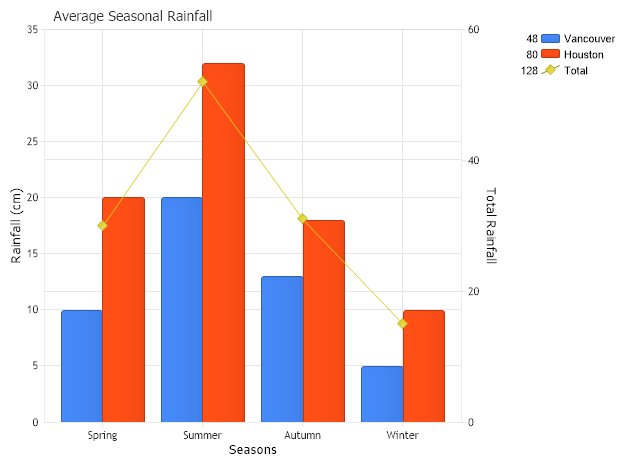
Gallery
Series Axis Binding
<%@ Page Language="C#" trace="false" Description="dotnetCHARTING Component"%>
<%@ Register TagPrefix="dotnet" Namespace="dotnetCHARTING" Assembly="dotnetCHARTING"%>
<%@ Import Namespace="System.Drawing" %>
<%@ Import Namespace="dotnetCHARTING" %>
<script runat="server">
void Page_Load(Object sender,EventArgs e)
{
//set global properties
Chart.Title="Average Seasonal Rainfall";
Chart.TempDirectory="temp";
Chart.Debug=true;
Chart.XAxis.Label.Text ="Seasons";
Chart.YAxis.NumberPercision=0;
Chart.YAxis.Label.Text="Rainfall (cm)";
//Chart.ChartArea.Line = new Line(Color.FromArgb(236, 236, 236), 1);
//Adding series programatically
Series sr=new Series();
sr.Name="Vancouver";
Element el = new Element("Spring",10);
sr.Elements.Add(el);
el = new Element("Summer",20);
sr.Elements.Add(el);
el = new Element("Autumn",13);
sr.Elements.Add(el);
el = new Element("Winter",5);
sr.Elements.Add(el);
Chart.SeriesCollection.Add(sr);
sr=new Series();
sr.Name="Houston";
el = new Element("Spring",20);
sr.Elements.Add(el);
el = new Element("Summer",32);
sr.Elements.Add(el);
el = new Element("Autumn",18);
sr.Elements.Add(el);
el = new Element("Winter",10);
sr.Elements.Add(el);
Chart.SeriesCollection.Add(sr);
//Add new calculatd series bound to a seperate axis
Chart.Series.Name = "Total";
Chart.Series.Type = SeriesType.Line;
Axis ATotal = new Axis();
ATotal.Orientation = dotnetCHARTING.Orientation.Right;
ATotal.Label.Text = "Total Rainfall";
Chart.Series.YAxis = ATotal;
Chart.SeriesCollection.Add(Calculation.Sum);
}
</script>
<html xmlns="http://www.w3.org/1999/xhtml"><head><title>Series Axis Binding Sample</title></head>
<body>
<p>
<dotnet:Chart id="Chart" runat="server"/>
</p>
</body>
</html>
<%@ Page Language="vb" trace="false" Description="dotnetCHARTING Component"%>
<%@ Register TagPrefix="dotnet" Namespace="dotnetCHARTING" Assembly="dotnetCHARTING"%>
<%@ Import Namespace="System.Drawing" %>
<%@ Import Namespace="dotnetCHARTING" %>
<script runat="server">
Sub Page_Load(ByVal sender As Object, ByVal e As EventArgs)
'set global properties
Chart.Title="Average Seasonal Rainfall"
Chart.TempDirectory="temp"
Chart.Debug=True
Chart.XAxis.Label.Text ="Seasons"
Chart.YAxis.NumberPercision=0
Chart.YAxis.Label.Text="Rainfall (cm)"
'Chart.ChartArea.Line = new Line(Color.FromArgb(236, 236, 236), 1);
'Adding series programatically
Dim sr As Series = New Series()
sr.Name="Vancouver"
Dim el As Element = New Element("Spring",10)
sr.Elements.Add(el)
el = New Element("Summer",20)
sr.Elements.Add(el)
el = New Element("Autumn",13)
sr.Elements.Add(el)
el = New Element("Winter",5)
sr.Elements.Add(el)
Chart.SeriesCollection.Add(sr)
sr = New Series()
sr.Name="Houston"
el = New Element("Spring",20)
sr.Elements.Add(el)
el = New Element("Summer",32)
sr.Elements.Add(el)
el = New Element("Autumn",18)
sr.Elements.Add(el)
el = New Element("Winter",10)
sr.Elements.Add(el)
Chart.SeriesCollection.Add(sr)
'Add new calculatd series bound to a seperate axis
Chart.Series.Name = "Total"
Chart.Series.Type = SeriesType.Line
Dim ATotal As Axis = New Axis()
ATotal.Orientation = dotnetCHARTING.Orientation.Right
ATotal.Label.Text = "Total Rainfall"
Chart.Series.YAxis = ATotal
Chart.SeriesCollection.Add(Calculation.Sum)
End Sub
</script>
<html xmlns="http://www.w3.org/1999/xhtml"><head><title>Series Axis Binding Sample</title></head>
<body>
<p>
<dotnet:Chart id="Chart" runat="server"/>
</p>
</body>
</html>
- Sample FilenameSeriesAxisBinding.aspx
- VersionLegacy (Pre 3.0)
- Uses DatabaseNo