// Demonstrates how to manipulate line cap scales.
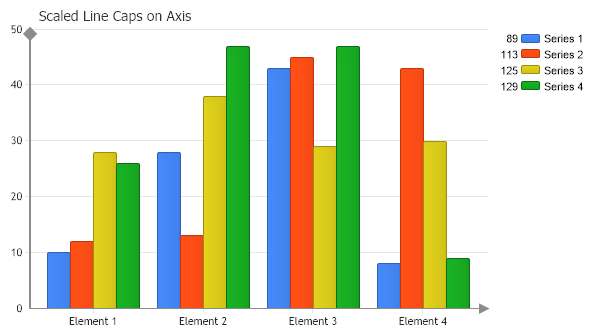
// X Axis. Chart.XAxis.Line.EndCap = LineCap.ArrowAnchor; Chart.XAxis.Line.AnchorCapScale = 5; Chart.XAxis.Line.Color = Color.FromArgb(140, 140, 140); // Y Axis, notice that the scale is less but the cap is larger the the x axis cap // because the original line width is larger. Chart.YAxis.Line.EndCap = LineCap.DiamondAnchor; Chart.YAxis.Line.AnchorCapScale = 3; Chart.YAxis.Line.Width = 2; Chart.YAxis.Line.Color = Color.FromArgb(140, 140, 140);
// *DYNAMIC DATA NOTE* // This sample uses random data to populate the chart. To populate // a chart with database data see the following resources: // - Classic samples folder // - Help File > Data Tutorials // - Sample: features/DataEngine.aspx SeriesCollection mySC = getRandomData();
// Add the random data. Chart.SeriesCollection.Add(mySC);
}
SeriesCollection getRandomData() { SeriesCollection SC = new SeriesCollection(); Random myR = new Random(); for(int a = 1; a < 5; a++) { Series s = new Series(); s.Name = "Series " + a; for(int b = 1; b < 5; b++) { Element e = new Element(); e.Name = "Element " + b; //e.YValue = -25 + myR.Next(50); e.YValue = myR.Next(50); s.Elements.Add(e); } SC.Add(s); }
' X Axis. Chart.XAxis.Line.EndCap = LineCap.ArrowAnchor Chart.XAxis.Line.AnchorCapScale = 5 Chart.XAxis.Line.Color = Color.FromArgb(140, 140, 140) ' Y Axis, notice that the scale is less but the cap is larger the the x axis cap ' because the original line width is larger. Chart.YAxis.Line.EndCap = LineCap.DiamondAnchor Chart.YAxis.Line.AnchorCapScale = 3 Chart.YAxis.Line.Width = 2 Chart.YAxis.Line.Color = Color.FromArgb(140, 140, 140)
' *DYNAMIC DATA NOTE* ' This sample uses random data to populate the chart. To populate ' a chart with database data see the following resources: ' - Classic samples folder ' - Help File > Data Tutorials ' - Sample: features/DataEngine.aspx Dim mySC As SeriesCollection = getRandomData()
' Add the random data. Chart.SeriesCollection.Add(mySC)
End Sub
Function getRandomData() As SeriesCollection Dim SC As SeriesCollection = New SeriesCollection() Dim myR As Random = New Random() For a As Integer = 1 To 4 Dim s As Series = New Series() s.Name = "Series " & a For b As Integer = 1 To 4 Dim e As Element = New Element() e.Name = "Element " & b 'e.YValue = -25 + myR.Next(50); e.YValue = myR.Next(50) s.Elements.Add(e) Next b SC.Add(s) Next a
Return SC End Function </script> </head> <body> <div style="text-align:center"> <dotnet:Chart id="Chart" runat="server" Width="568px" Height="344px"> </dotnet:Chart> </div> </body> </html>