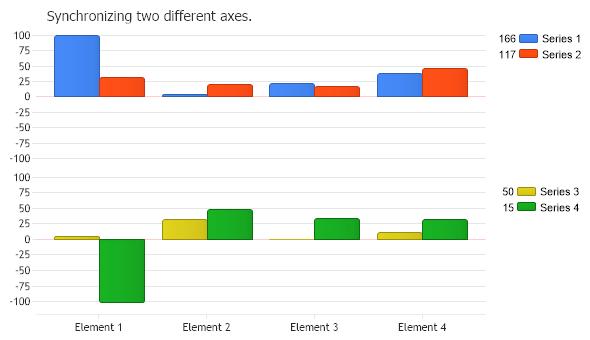
void Page_Load(Object sender,EventArgs e) { // Demonstrates how to synchronize two axis scales. Chart.Type = ChartType.Combo;//Horizontal; Chart.Width = 600; Chart.Height = 350; Chart.TempDirectory = "temp"; Chart.Debug = true; Chart.Title = "Synchronizing two different axes.";
// The following code will synchronize the new axis with the default y axis. Axis newAxis = new Axis(); newAxis.Line.Color = Color.Empty; Chart.YAxis.SynchronizeScale.Add(newAxis);
// *DYNAMIC DATA NOTE* // This sample uses random data to populate the chart. To populate // a chart with database data see the following resources: // - Classic samples folder // - Help File > Data Tutorials // - Sample: features/DataEngine.aspx SeriesCollection mySC = getRandomData();
// Change the values of elements to demonstrate ensure the axis scales would not be the same. mySC[0][0].YValue = 100; mySC[3][0].YValue = -100;
// Specify the new axis for two of the series and add them to a different chart area. mySC[2].YAxis = newAxis; mySC[3].YAxis = newAxis; ChartArea ca = new ChartArea(new SeriesCollection(mySC[2], mySC[3])); ca.LegendBox.ClearColors(); ca.LegendBox.Position = new Point(495, 190); Chart.ExtraChartAreas.Add(ca);
// Add the random data. Chart.SeriesCollection.Add(mySC[0],mySC[1]);
}
SeriesCollection getRandomData() { SeriesCollection SC = new SeriesCollection(); Random myR = new Random(1); for(int a = 1; a < 5; a++) { Series s = new Series(); s.Name = "Series " + a; for(int b = 1; b < 5; b++) { Element e = new Element(); e.Name = "Element " + b; e.YValue = myR.Next(50); s.Elements.Add(e); } SC.Add(s); }
Sub Page_Load(ByVal sender As Object, ByVal e As EventArgs) ' Demonstrates how to synchronize two axis scales. Chart.Type = ChartType.Combo 'Horizontal; Chart.Width = 600 Chart.Height = 350 Chart.TempDirectory = "temp" Chart.Debug = True Chart.Title = "Synchronizing two different axes."
' The following code will synchronize the new axis with the default y axis. Dim newAxis As Axis = New Axis() newAxis.Line.Color = Color.Empty Chart.YAxis.SynchronizeScale.Add(newAxis)
' *DYNAMIC DATA NOTE* ' This sample uses random data to populate the chart. To populate ' a chart with database data see the following resources: ' - Classic samples folder ' - Help File > Data Tutorials ' - Sample: features/DataEngine.aspx Dim mySC As SeriesCollection = getRandomData()
' Change the values of elements to demonstrate ensure the axis scales would not be the same. mySC(0)(0).YValue = 100 mySC(3)(0).YValue = -100
' Specify the new axis for two of the series and add them to a different chart area. mySC(2).YAxis = newAxis mySC(3).YAxis = newAxis Dim ca As ChartArea = New ChartArea(New SeriesCollection(mySC(2), mySC(3))) ca.LegendBox.ClearColors() ca.LegendBox.Position = New Point(495, 190) Chart.ExtraChartAreas.Add(ca)
' Add the random data. Chart.SeriesCollection.Add(mySC(0),mySC(1))
End Sub
Function getRandomData() As SeriesCollection Dim SC As SeriesCollection = New SeriesCollection() Dim myR As Random = New Random(1) For a As Integer = 1 To 4 Dim s As Series = New Series() s.Name = "Series " & a For b As Integer = 1 To 4 Dim e As Element = New Element() e.Name = "Element " & b e.YValue = myR.Next(50) s.Elements.Add(e) Next b SC.Add(s) Next a
Return SC End Function </script> </head> <body> <div style="text-align:center"> <dotnet:Chart id="Chart" runat="server" Width="568px" Height="344px"> </dotnet:Chart> </div> </body> </html>