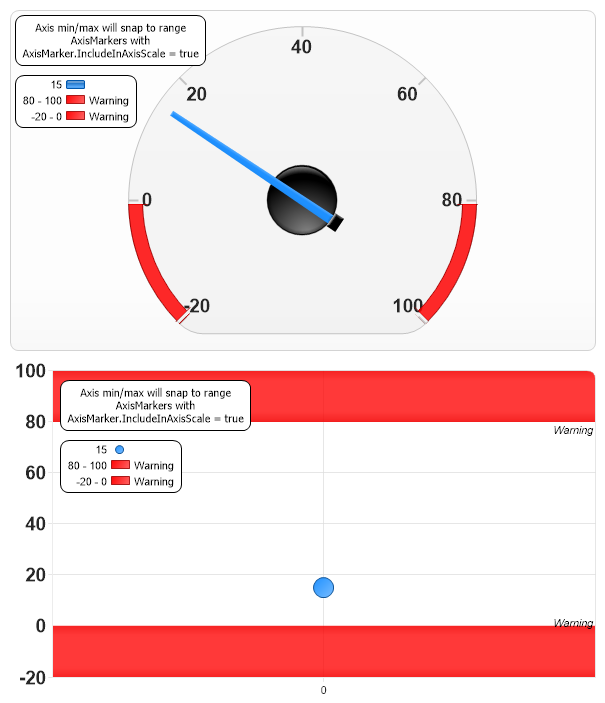
Axis Range In Scale
Demonstrates using an axis marker with IncludeInAxisScale set to true. The axis min/max snap to the marker range automatically.
<%@ Page Language="C#" Description="dotnetCHARTING Component" %>
<%@ Register TagPrefix="dnc" Namespace="dotnetCHARTING" Assembly="dotnetCHARTING" %>
<%@ Import Namespace="System.Drawing" %>
<script runat="server">
void Page_Load(Object sender, EventArgs e)
{
// Demonstrates using an axis marker with IncludeInAxisScale set to true. The axis min/max snap to the marker range automatically.
SetChart(Chart);
SetChart(Chart1);
Chart.Type = ChartType.Gauges;
Chart.ChartArea.Background.Color = Color.FromArgb(100, 250, 250, 250);
Chart.ChartArea.Line.Color = Color.LightGray;
Chart1.Type = ChartType.Combo;
Chart1.DefaultSeries.Type = SeriesType.Marker;
Chart1.LegendBox.Position = new Point(55, 85);
Chart1.Annotations[0].Position = new Point(55,25);
Chart1.DefaultElement.Marker.Size = 20;
Chart1.YAxis.Interval = 20;
}
void SetChart(Chart c)
{
c.Size = "600x350";
c.LegendBox.Position = new Point(10, 70);
c.LegendBox.Line.Color = Color.Black;
c.LegendBox.Background.Color = Color.White;
c.TempDirectory = "temp";
c.Debug = true;
c.Palette[0] = Color.DodgerBlue;
c.DefaultBox.DefaultCorner = BoxCorner.Round;
c.ShadingEffectMode = ShadingEffectMode.Three;
// Add an annotation.
Annotation an = new Annotation("Axis min/max will snap to range AxisMarkers with AxisMarker.IncludeInAxisScale = true ");
an.Position = new Point(10, 10);
an.Size = new Size(190, 50);
an.Line.Color = Color.Black;
an.Background.Color = Color.White;
an.Label.Font = new Font("Tahoma", 8);
c.Annotations.Add(an);
// Style the gauge.
c.DefaultSeries.GaugeBorderBox.Background.Color =Color.FromArgb(100, 230, 230, 230);
c.YAxis.DefaultTick.Label.Font = new Font("Arial", 14, FontStyle.Bold);
// Add axis markers.
AxisMarker am = new AxisMarker("Warning", Color.Red, 80, 100);
am.Background.Color = Color.FromArgb(255, 255, 0, 0);
am.IncludeInAxisScale = true;
AxisMarker am2 = new AxisMarker("Warning", Color.Red, -20, 0);
am2.IncludeInAxisScale = true;
c.YAxis.Markers.Add(am, am2);
// Add some data
Series s = Series.FromYValues(15);
c.SeriesCollection.Add(s);
}
</script>
<html xmlns="http://www.w3.org/1999/xhtml">
<head>
<title>.netCHARTING Sample</title>
</head>
<body>
<div align="center">
<dnc:Chart ID="Chart" runat="server" />
<dnc:Chart ID="Chart1" runat="server" />
</div>
</body>
</html>
<%@ Page Language="vb" Description="dotnetCHARTING Component" %>
<%@ Register TagPrefix="dnc" Namespace="dotnetCHARTING" Assembly="dotnetCHARTING" %>
<%@ Import Namespace="System.Drawing" %>
<script runat="server">
Sub Page_Load(ByVal sender As Object, ByVal e As EventArgs)
' Demonstrates using an axis marker with IncludeInAxisScale set to true. The axis min/max snap to the marker range automatically.
SetChart(Chart)
SetChart(Chart1)
Chart.Type = ChartType.Gauges
Chart.ChartArea.Background.Color = Color.FromArgb(100, 250, 250, 250)
Chart.ChartArea.Line.Color = Color.LightGray
Chart1.Type = ChartType.Combo
Chart1.DefaultSeries.Type = SeriesType.Marker
Chart1.LegendBox.Position = New Point(55, 85)
Chart1.Annotations(0).Position = New Point(55,25)
Chart1.DefaultElement.Marker.Size = 20
Chart1.YAxis.Interval = 20
End Sub
Sub SetChart(ByVal c As Chart)
c.Size = "600x350"
c.LegendBox.Position = New Point(10, 70)
c.LegendBox.Line.Color = Color.Black
c.LegendBox.Background.Color = Color.White
c.TempDirectory = "temp"
c.Debug = True
c.Palette(0) = Color.DodgerBlue
c.DefaultBox.DefaultCorner = BoxCorner.Round
c.ShadingEffectMode = ShadingEffectMode.Three
' Add an annotation.
Dim an As Annotation = New Annotation("Axis min/max will snap to range AxisMarkers with AxisMarker.IncludeInAxisScale = true ")
an.Position = New Point(10, 10)
an.Size = New Size(190, 50)
an.Line.Color = Color.Black
an.Background.Color = Color.White
an.Label.Font = New Font("Tahoma", 8)
c.Annotations.Add(an)
' Style the gauge.
c.DefaultSeries.GaugeBorderBox.Background.Color =Color.FromArgb(100, 230, 230, 230)
c.YAxis.DefaultTick.Label.Font = New Font("Arial", 14, FontStyle.Bold)
' Add axis markers.
Dim am As AxisMarker = New AxisMarker("Warning", Color.Red, 80, 100)
am.Background.Color = Color.FromArgb(255, 255, 0, 0)
am.IncludeInAxisScale = True
Dim am2 As AxisMarker = New AxisMarker("Warning", Color.Red, -20, 0)
am2.IncludeInAxisScale = True
c.YAxis.Markers.Add(am, am2)
' Add some data
Dim s As Series = Series.FromYValues(15)
c.SeriesCollection.Add(s)
End Sub
</script>
<html xmlns="http://www.w3.org/1999/xhtml">
<head>
<title>.netCHARTING Sample</title>
</head>
<body>
<div align="center">
<dnc:Chart ID="Chart" runat="server" />
<dnc:Chart ID="Chart1" runat="server" />
</div>
</body>
</html>