// Demonstrates the different positions axes can be oriented.
// *DYNAMIC DATA NOTE* // This sample uses random data to populate the chart. To populate // a chart with database data see the following resources: // - Classic samples folder // - Help File > Data Tutorials // - Sample: features/DataEngine.aspx SeriesCollection mySC = getRandomData();
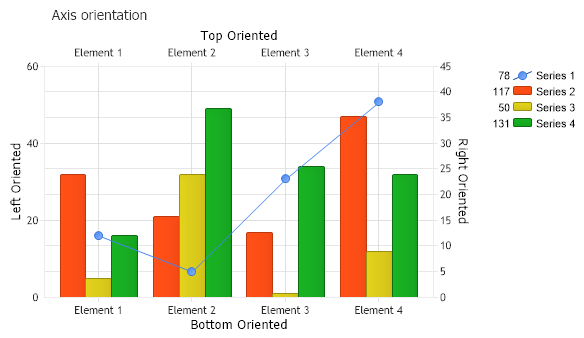
//We'll add a new y and x axis to one of the series and change their dotnetCHARTING.Orientation. mySC[0].YAxis = new Axis("Right Oriented"); mySC[0].YAxis.Orientation = dotnetCHARTING.Orientation.Right;
mySC[0].XAxis = new Axis("Top Oriented"); mySC[0].XAxis.Orientation = dotnetCHARTING.Orientation.Top;
mySC[0].Type = SeriesType.Line;
// Label the default axes Chart.XAxis.Label.Text = "Bottom Oriented";
// Label the default axes Chart.YAxis.Label.Text = "Left Oriented";
// Add the random data. Chart.SeriesCollection.Add(mySC);
}
SeriesCollection getRandomData() { SeriesCollection SC = new SeriesCollection(); Random myR = new Random(1); for(int a = 1; a < 5; a++) { Series s = new Series(); s.Name = "Series " + a; for(int b = 1; b < 5; b++) { Element e = new Element(); e.Name = "Element " + b; //e.YValue = -25 + myR.Next(50); e.YValue = myR.Next(50); s.Elements.Add(e); } SC.Add(s); }
' Demonstrates the different positions axes can be oriented.
' *DYNAMIC DATA NOTE* ' This sample uses random data to populate the chart. To populate ' a chart with database data see the following resources: ' - Classic samples folder ' - Help File > Data Tutorials ' - Sample: features/DataEngine.aspx Dim mySC As SeriesCollection = getRandomData()
'We'll add a new y and x axis to one of the series and change their dotnetCHARTING.Orientation. mySC(0).YAxis = New Axis("Right Oriented") mySC(0).YAxis.Orientation = dotnetCHARTING.Orientation.Right
mySC(0).XAxis = New Axis("Top Oriented") mySC(0).XAxis.Orientation = dotnetCHARTING.Orientation.Top
mySC(0).Type = SeriesType.Line
' Label the default axes Chart.XAxis.Label.Text = "Bottom Oriented"
' Label the default axes Chart.YAxis.Label.Text = "Left Oriented"
' Add the random data. Chart.SeriesCollection.Add(mySC)
End Sub
Function getRandomData() As SeriesCollection Dim SC As SeriesCollection = New SeriesCollection() Dim myR As Random = New Random(1) For a As Integer = 1 To 4 Dim s As Series = New Series() s.Name = "Series " & a For b As Integer = 1 To 4 Dim e As Element = New Element() e.Name = "Element " & b 'e.YValue = -25 + myR.Next(50); e.YValue = myR.Next(50) s.Elements.Add(e) Next b SC.Add(s) Next a
Return SC End Function </script> </head> <body> <div style="text-align:center"> <dotnet:Chart id="Chart" runat="server" Width="568px" Height="344px"> </dotnet:Chart> </div> </body> </html>