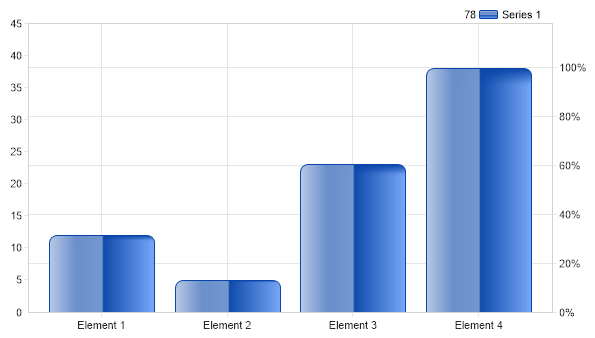
Gallery
Percent Axis
<%@ Page Language="C#" Description="dotnetCHARTING Component" %>
<%@ Register TagPrefix="dnc" Namespace="dotnetCHARTING" Assembly="dotnetCHARTING" %>
<%@ Import Namespace="System.Drawing" %>
<%@ Import Namespace="System.Drawing.Drawing2D" %>
<%@ Import Namespace="dotnetCHARTING.Mapping" %>
<script runat="server">
void Page_Load(Object sender, EventArgs e)
{
// Demonstrates how an axis showing the percent of the data's maximum value can be added.
// Setup the chart
Chart.Size = "600x350";
//Chart.Title = ".netCHARTING Sample";
Chart.TempDirectory = "temp";
Chart.Debug = true;
Chart.LegendBox.Position = LegendBoxPosition.ChartArea;
Chart.DefaultAxis.Line.Color = Color.LightGray;
Chart.ChartArea.Line.Color = Color.LightGray;
Chart.YAxis.AlternateGridBackground.Color = Color.Empty;
Chart.YAxis.DefaultTick.GridLine.Color = Color.Empty;
Chart.ShadingEffectMode = ShadingEffectMode.Two;
Chart.TitleBox.Position = TitleBoxPosition.FullWithLegend;
// *DYNAMIC DATA NOTE*
// This sample uses random data to populate the chart. To populate
// a chart with database data see the following resources:
// - Use the getLiveData() method using the dataEngine to query a database.
// - Help File > Getting Started > Data Tutorials
// - DataEngine Class in the help file
// - Sample: features/DataEngine.aspx
SeriesCollection mySC = getRandomData();
// Add the random data.
Chart.SeriesCollection.Add(mySC);
// Make the chart generate.
Chart.GetChartBitmap();
// Get chart area rectangle
Point[] caPoints = Chart.ChartArea.GetCoordinates();
GraphicsPath gp = new GraphicsPath();
gp.AddPolygon(caPoints);
RectangleF caRect = gp.GetBounds();
gp.Dispose();
// Get axis ranges
double yHigh = (double)Chart.YAxis.GetValueAtY("100," + ((int)caRect.Top + 1).ToString());
double yLow = (double)Chart.YAxis.GetValueAtY("100," + ((int)caRect.Bottom).ToString());
// Create a new invisible element to show use with the new percent axis.
Element e1 = new Element("Element 1", 5);
Series ser = new Series("", e1);
ser.Type = SeriesType.Marker;
ser.LegendEntry.Visible = false;
ser.DefaultElement.Color = Color.Empty;
// Get the max value of the series.
double max = mySC[0].Calculate("", Calculation.Maximum).YValue;
// Create a new axis showing the percent of the element maximum.
Axis a2 = new Axis();
a2.Orientation = dotnetCHARTING.Orientation.Right;
a2.Percent = true;
a2.ScaleRange = new ScaleRange(0,yHigh*100/max);
ser.YAxis = a2;
// Add the series with the new axis.
Chart.SeriesCollection.Add(ser);
}
SeriesCollection getRandomData()
{
Random myR = new Random(1);
SeriesCollection SC = new SeriesCollection();
for (int a = 1; a < 2; a++)
{
Series s = new Series("Series " + a.ToString());
for (int b = 1; b < 5; b++)
{
Element e = new Element("Element " + b.ToString());
e.YValue = myR.Next(50);
s.Elements.Add(e);
}
SC.Add(s);
}
return SC;
}
SeriesCollection getLiveData()
{
DataEngine de = new DataEngine("ConnectionString goes here");
de.ChartObject = Chart; // Necessary to view any errors the dataEngine may throw.
de.SqlStatement = "SELECT XAxisColumn, YAxisColumn FROM ....";
return de.GetSeries();
}
</script>
<html xmlns="http://www.w3.org/1999/xhtml">
<head>
<title>.netCHARTING Sample</title>
</head>
<body>
<div align="center">
<dnc:Chart ID="Chart" runat="server" />
</div>
</body>
</html>
<%@ Page Language="vb" Description="dotnetCHARTING Component" %>
<%@ Register TagPrefix="dnc" Namespace="dotnetCHARTING" Assembly="dotnetCHARTING" %>
<%@ Import Namespace="System.Drawing" %>
<%@ Import Namespace="System.Drawing.Drawing2D" %>
<%@ Import Namespace="dotnetCHARTING.Mapping" %>
<script runat="server">
Sub Page_Load(ByVal sender As Object, ByVal e As EventArgs)
' Demonstrates how an axis showing the percent of the data's maximum value can be added.
' Setup the chart
Chart.Size = "600x350"
'Chart.Title = ".netCHARTING Sample";
Chart.TempDirectory = "temp"
Chart.Debug = True
Chart.LegendBox.Position = LegendBoxPosition.ChartArea
Chart.DefaultAxis.Line.Color = Color.LightGray
Chart.ChartArea.Line.Color = Color.LightGray
Chart.YAxis.AlternateGridBackground.Color = Color.Empty
Chart.YAxis.DefaultTick.GridLine.Color = Color.Empty
Chart.ShadingEffectMode = ShadingEffectMode.Two
Chart.TitleBox.Position = TitleBoxPosition.FullWithLegend
' *DYNAMIC DATA NOTE*
' This sample uses random data to populate the chart. To populate
' a chart with database data see the following resources:
' - Use the getLiveData() method using the dataEngine to query a database.
' - Help File > Getting Started > Data Tutorials
' - DataEngine Class in the help file
' - Sample: features/DataEngine.aspx
Dim mySC As SeriesCollection = getRandomData()
' Add the random data.
Chart.SeriesCollection.Add(mySC)
' Make the chart generate.
Chart.GetChartBitmap()
' Get chart area rectangle
Dim caPoints As Point() = Chart.ChartArea.GetCoordinates()
Dim gp As GraphicsPath = New GraphicsPath()
gp.AddPolygon(caPoints)
Dim caRect As RectangleF = gp.GetBounds()
gp.Dispose()
' Get axis ranges
Dim yHigh As Double = CDbl(Chart.YAxis.GetValueAtY("100," & (CInt(Fix(caRect.Top)) + 1).ToString()))
Dim yLow As Double = CDbl(Chart.YAxis.GetValueAtY("100," & (CInt(Fix(caRect.Bottom))).ToString()))
' Create a new invisible element to show use with the new percent axis.
Dim e1 As Element = New Element("Element 1", 5)
Dim ser As Series = New Series("", e1)
ser.Type = SeriesType.Marker
ser.LegendEntry.Visible = False
ser.DefaultElement.Color = Color.Empty
' Get the max value of the series.
Dim max As Double = mySC(0).Calculate("", Calculation.Maximum).YValue
' Create a new axis showing the percent of the element maximum.
Dim a2 As Axis = New Axis()
a2.Orientation = dotnetCHARTING.Orientation.Right
a2.Percent = True
a2.ScaleRange = New ScaleRange(0,yHigh*100/max)
ser.YAxis = a2
' Add the series with the new axis.
Chart.SeriesCollection.Add(ser)
End Sub
Function getRandomData() As SeriesCollection
Dim myR As Random = New Random(1)
Dim SC As SeriesCollection = New SeriesCollection()
For a As Integer = 1 To 1
Dim s As Series = New Series("Series " & a.ToString())
For b As Integer = 1 To 4
Dim e As Element = New Element("Element " & b.ToString())
e.YValue = myR.Next(50)
s.Elements.Add(e)
Next b
SC.Add(s)
Next a
Return SC
End Function
Function getLiveData() As SeriesCollection
Dim de As DataEngine = New DataEngine("ConnectionString goes here")
de.ChartObject = Chart ' Necessary to view any errors the dataEngine may throw.
de.SqlStatement = "SELECT XAxisColumn, YAxisColumn FROM ...."
Return de.GetSeries()
End Function
</script>
<html xmlns="http://www.w3.org/1999/xhtml">
<head>
<title>.netCHARTING Sample</title>
</head>
<body>
<div align="center">
<dnc:Chart ID="Chart" runat="server" />
</div>
</body>
</html>
- Sample FilenamePercentAxis.aspx
- Version5.3
- Uses DatabaseNo