Calendar Pattern
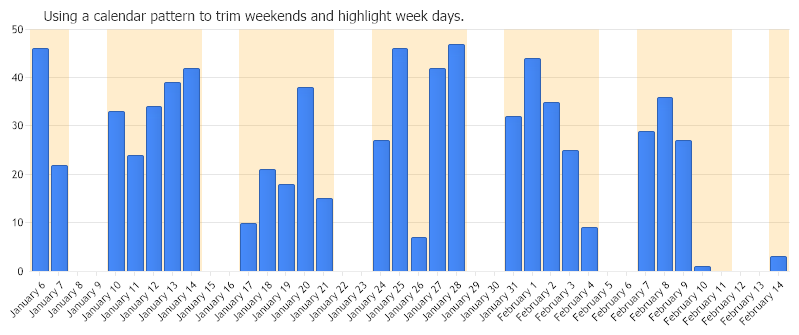
How a calendar pattern can be used to trim data and highlight chart area sections.
<%@ Page Language="C#" Description="dotnetCHARTING Component" %>
<%@ Register TagPrefix="dotnet" Namespace="dotnetCHARTING" Assembly="dotnetCHARTING"%>
<%@ Import Namespace="System.Drawing" %>
<html xmlns="http://www.w3.org/1999/xhtml">
<head>
<title>.netCHARTING Sample</title>
<script runat="server">
void Page_Load(Object sender,EventArgs e)
{
Chart.Type = ChartType.Combo;
Chart.Width = 800;
Chart.Height = 350;
Chart.TempDirectory = "temp";
Chart.Debug = true;
Chart.Title = "Using a calendar pattern to trim weekends and highlight week days.";
Chart.LegendBox.Visible = false;
//Chart.DefaultSeries.DefaultElement.Transparency = 50;
// Demonstrates how a calendar pattern can be used to trim data and highlight chart area sections.
// It shows how to
// - Create and manipulate a calendar pattern
// - Use it to trim elements
// - Use it with axis markers.
// - Setup axis intervals to match data
// *DYNAMIC DATA NOTE*
// This sample uses random data to populate the chart. To populate
// a chart with database data see the following resources:
// - Classic samples folder
// - Help File > Data Tutorials
// - Sample: features/DataEngine.aspx
SeriesCollection sc = getRandomData();
// CREATE A PATTERN
// We instantiate a calendar patter, and specify that day is represented by each of the 0 & 1
// values, week is represented by the whole string.
CalendarPattern cp = new CalendarPattern(TimeInterval.Day,TimeInterval.Week,"1000001");
// Because tick marks usually start at the beginning of the day instead of the middle an adjustment unit is specified
// to compensate for this offset. This will ensure your tick marks match the calendar pattern.
cp.AdjustmentUnit = TimeInterval.Day;
// TRIM A SERIES
//To trim elements with this patterm we use the Trim method of the Series object.
sc[0].Trim(cp,ElementValue.XDateTime);
// INVERT THE PATTERN
// We have trimmed out the weekends but now the pattern will be used with an axis marker to show the week days
// not the weekends so it must be inverted.
cp.Invert();
// Now the pattern will look like this: "0111110"
// USE A PATTERN WITH AN AXIS MARKER
// An axis marker is initialized.
AxisMarker am = new AxisMarker("",new Background(Color.FromArgb(100,Color.Orange)),0,0);
am.Background.Color = Color.FromArgb(50,Color.Orange);
// Our inverted calendar pattern is specified.
am.CalendarPattern = cp;
am.LegendEntry = new LegendEntry("Week Days","");
// Add it to the x axis.
Chart.XAxis.Markers.Add(am);
// SETUP AXIS INTERVAL TO WORK WITH DATA
// The effect we want is for the labels to be centered in the middle of each week and
// grid lines to be in the middle of the weekend.
// We'll set week as the TimeInterval for the x axis.
Chart.XAxis.TimeInterval = TimeInterval.Days;
// Next we set a start time for the interval (Middle of the week) The selected is 11/11/2004 (which is a thursday)
Chart.XAxis.TimeIntervalAdvanced.Start = new DateTime(2024,11,11);//,22,0,0,0);
// Add the random data.
Chart.SeriesCollection.Add(sc);
}
SeriesCollection getRandomData()
{
SeriesCollection SC = new SeriesCollection();
Random myR = new Random();
DateTime dt = new DateTime(2005,1,5);
for(int a = 1; a < 2; a++)
{
Series s = new Series();
s.Name = "Series " + a;
for(int b = 1; b < 41; b++)
{
dt = dt.AddDays(1);
Element e = new Element();
e.XDateTime = dt;;
e.YValue = myR.Next(50);
s.Elements.Add(e);
}
SC.Add(s);
}
return SC;
}
</script>
</head>
<body>
<div style="text-align:center">
<dotnet:Chart id="Chart" runat="server" Width="568px" Height="344px">
</dotnet:Chart>
</div>
</body>
</html>
<%@ Page Language="vb" Description="dotnetCHARTING Component" %>
<%@ Register TagPrefix="dotnet" Namespace="dotnetCHARTING" Assembly="dotnetCHARTING"%>
<%@ Import Namespace="System.Drawing" %>
<html xmlns="http://www.w3.org/1999/xhtml">
<head>
<title>.netCHARTING Sample</title>
<script runat="server">
Sub Page_Load(ByVal sender As Object, ByVal e As EventArgs)
Chart.Type = ChartType.Combo
Chart.Width = 800
Chart.Height = 350
Chart.TempDirectory = "temp"
Chart.Debug = True
Chart.Title = "Using a calendar pattern to trim weekends and highlight week days."
Chart.LegendBox.Visible = False
'Chart.DefaultSeries.DefaultElement.Transparency = 50;
' Demonstrates how a calendar pattern can be used to trim data and highlight chart area sections.
' It shows how to
' - Create and manipulate a calendar pattern
' - Use it to trim elements
' - Use it with axis markers.
' - Setup axis intervals to match data
' *DYNAMIC DATA NOTE*
' This sample uses random data to populate the chart. To populate
' a chart with database data see the following resources:
' - Classic samples folder
' - Help File > Data Tutorials
' - Sample: features/DataEngine.aspx
Dim sc As SeriesCollection = getRandomData()
' CREATE A PATTERN
' We instantiate a calendar patter, and specify that day is represented by each of the 0 & 1
' values, week is represented by the whole string.
Dim cp As CalendarPattern = New CalendarPattern(TimeInterval.Day,TimeInterval.Week,"1000001")
' Because tick marks usually start at the beginning of the day instead of the middle an adjustment unit is specified
' to compensate for this offset. This will ensure your tick marks match the calendar pattern.
cp.AdjustmentUnit = TimeInterval.Day
' TRIM A SERIES
'To trim elements with this patterm we use the Trim method of the Series object.
sc(0).Trim(cp,ElementValue.XDateTime)
' INVERT THE PATTERN
' We have trimmed out the weekends but now the pattern will be used with an axis marker to show the week days
' not the weekends so it must be inverted.
cp.Invert()
' Now the pattern will look like this: "0111110"
' USE A PATTERN WITH AN AXIS MARKER
' An axis marker is initialized.
Dim am As AxisMarker = New AxisMarker("",New Background(Color.FromArgb(100,Color.Orange)),0,0)
am.Background.Color = Color.FromArgb(50,Color.Orange)
' Our inverted calendar pattern is specified.
am.CalendarPattern = cp
am.LegendEntry = New LegendEntry("Week Days","")
' Add it to the x axis.
Chart.XAxis.Markers.Add(am)
' SETUP AXIS INTERVAL TO WORK WITH DATA
' The effect we want is for the labels to be centered in the middle of each week and
' grid lines to be in the middle of the weekend.
' We'll set week as the TimeInterval for the x axis.
Chart.XAxis.TimeInterval = TimeInterval.Days
' Next we set a start time for the interval (Middle of the week) The selected is 11/11/2004 (which is a thursday)
Chart.XAxis.TimeIntervalAdvanced.Start = New DateTime(2024,11,11) ',22,0,0,0);
' Add the random data.
Chart.SeriesCollection.Add(sc)
End Sub
Function getRandomData() As SeriesCollection
Dim SC As SeriesCollection = New SeriesCollection()
Dim myR As Random = New Random()
Dim dt As DateTime = New DateTime(2005,1,5)
For a As Integer = 1 To 1
Dim s As Series = New Series()
s.Name = "Series " & a
For b As Integer = 1 To 40
dt = dt.AddDays(1)
Dim e As Element = New Element()
e.XDateTime = dt
e.YValue = myR.Next(50)
s.Elements.Add(e)
Next b
SC.Add(s)
Next a
Return SC
End Function
</script>
</head>
<body>
<div style="text-align:center">
<dotnet:Chart id="Chart" runat="server" Width="568px" Height="344px">
</dotnet:Chart>
</div>
</body>
</html>