// First we get our data, if you would like to get the data from a database you need to use // the data engine. See sample: features/dataEngine.aspx. Or the dataEngine tutorial in the help file. SeriesCollection mySC = getRandomData();
// We'll make the axis line a translucent black color and add some width so the caps can be seen better. Chart.XAxis.Line.Color = Color.FromArgb(255,0,0,0); Chart.XAxis.Line.Width = 5;
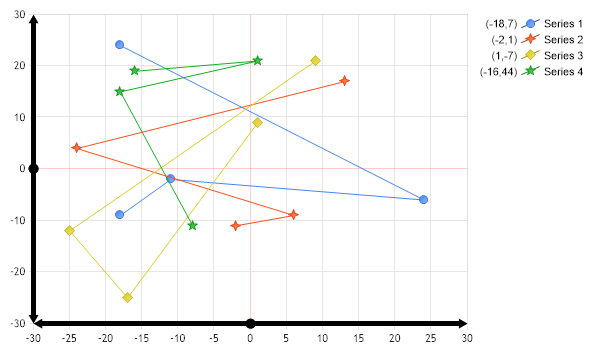
// The axis lines are drawn from origin. If the origin is in the middle of the chart, two axis lines are drawn. // Axis lines can be marked with caps like so: Chart.XAxis.Line.StartCap = LineCap.RoundAnchor; Chart.XAxis.Line.EndCap = LineCap.ArrowAnchor; Chart.XAxis.Line.AnchorCapScale = 1;
// The axis lines are drawn from origin. If the origin is in the middle of the chart, two axis lines are drawn. // Axis lines can be marked with caps like so: Chart.YAxis.Line.StartCap = LineCap.RoundAnchor; Chart.YAxis.Line.EndCap = LineCap.ArrowAnchor; Chart.YAxis.Line.AnchorCapScale = 1;
// This will mark all the lines in the same manner.
// Add the some random data. Chart.SeriesCollection.Add(mySC);
}
SeriesCollection getRandomData() { SeriesCollection SC = new SeriesCollection(); Random myR = new Random(); for(int a = 1; a < 5; a++) { Series s = new Series(); s.Name = "Series " + a; for(int b = 1; b < 5; b++) { Element e = new Element(); e.Name = "Element " + b;
' First we get our data, if you would like to get the data from a database you need to use ' the data engine. See sample: features/dataEngine.aspx. Or the dataEngine tutorial in the help file. Dim mySC As SeriesCollection = getRandomData()
' We'll make the axis line a translucent black color and add some width so the caps can be seen better. Chart.XAxis.Line.Color = Color.FromArgb(255,0,0,0) Chart.XAxis.Line.Width = 5
' The axis lines are drawn from origin. If the origin is in the middle of the chart, two axis lines are drawn. ' Axis lines can be marked with caps like so: Chart.XAxis.Line.StartCap = LineCap.RoundAnchor Chart.XAxis.Line.EndCap = LineCap.ArrowAnchor Chart.XAxis.Line.AnchorCapScale = 1
' The axis lines are drawn from origin. If the origin is in the middle of the chart, two axis lines are drawn. ' Axis lines can be marked with caps like so: Chart.YAxis.Line.StartCap = LineCap.RoundAnchor Chart.YAxis.Line.EndCap = LineCap.ArrowAnchor Chart.YAxis.Line.AnchorCapScale = 1
' This will mark all the lines in the same manner.
' Add the some random data. Chart.SeriesCollection.Add(mySC)
End Sub
Function getRandomData() As SeriesCollection Dim SC As SeriesCollection = New SeriesCollection() Dim myR As Random = New Random() For a As Integer = 1 To 4 Dim s As Series = New Series() s.Name = "Series " & a For b As Integer = 1 To 4 Dim e As Element = New Element() e.Name = "Element " & b
e.YValue = -25 + myR.Next(50) e.XValue = -25 + myR.Next(50) s.Elements.Add(e) Next b SC.Add(s) Next a