// *DYNAMIC DATA NOTE* // This sample uses random data to populate the chart. To populate // a chart with database data see the following resources: // - Classic samples folder // - Help File > Data Tutorials // - Sample: features/DataEngine.aspx Chart.SeriesCollection.Add(getRandomData());
}
SeriesCollection getRandomData() { SeriesCollection SC = new SeriesCollection(); Random myR = new Random(); for(int a = 1; a < 5; a++) { Series s = new Series(); s.Name = "Series " + a; for(int b = 1; b < 5; b++) { Element e = new Element(); e.Name = "Element " + b; //e.YValue = -25 + myR.Next(50); e.YValue = myR.Next(500); s.Elements.Add(e); } SC.Add(s); }
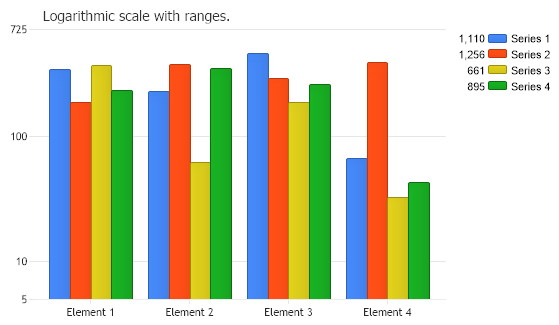
Sub Page_Load(ByVal sender As Object, ByVal e As EventArgs) Chart.TempDirectory = "temp" Chart.Debug = True Chart.Title = "Logarithmic scale with ranges."
' Demonstrates setting an axis range with the logarithmic scale.
' Set the axis scale. Chart.YAxis.Scale = Scale.Logarithmic
' The range can be set using this code: Chart.YAxis.ScaleRange.ValueHigh = 725 Chart.YAxis.ScaleRange.ValueLow = 50
' Or using this code: Chart.YAxis.ScaleRange = New ScaleRange(5, 725)
' *DYNAMIC DATA NOTE* ' This sample uses random data to populate the chart. To populate ' a chart with database data see the following resources: ' - Classic samples folder ' - Help File > Data Tutorials ' - Sample: features/DataEngine.aspx Chart.SeriesCollection.Add(getRandomData())
End Sub
Function getRandomData() As SeriesCollection Dim SC As SeriesCollection = New SeriesCollection() Dim myR As Random = New Random() For a As Integer = 1 To 4 Dim s As Series = New Series() s.Name = "Series " & a For b As Integer = 1 To 4 Dim e As Element = New Element() e.Name = "Element " & b 'e.YValue = -25 + myR.Next(50); e.YValue = myR.Next(500) s.Elements.Add(e) Next b SC.Add(s) Next a
Return SC End Function </script> </head> <body> <div style="text-align:center"> <dotnet:Chart id="Chart" runat="server" Width="568px" Height="341px"></dotnet:Chart> </div> </body> </html>