- JS Hidden Ticks
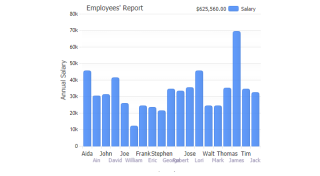
Demonstrates using defaultHiddenTick to stagger tick labels by setting a pixel offset for ticks that are overlapped.
- JS Gridless Gridlines
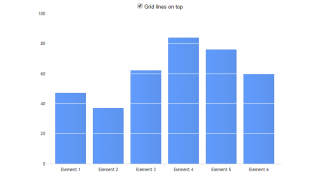
Demonstrates adding markers to series that dont use them by default.
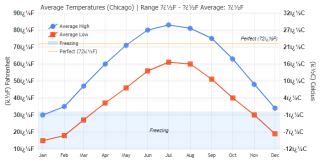
- JS Axis Cal Pat Ticks
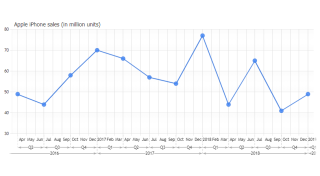
This sample deomonstrates interval calendar pattern ranges on a time scale axis.
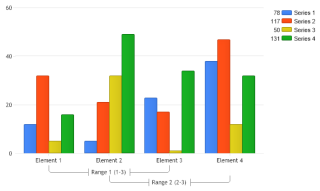
- JS Axis Cat Groups
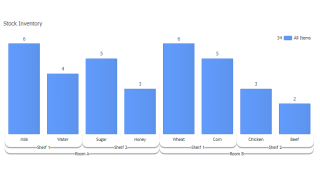
This sample deomonstrates multi-level category axis range tick labels.
- JS Axis Series Groups
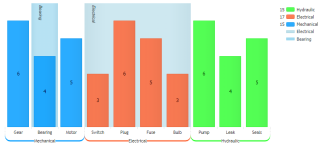
This sample deomonstrates multi-level category axis range tick labels.
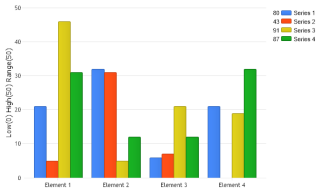
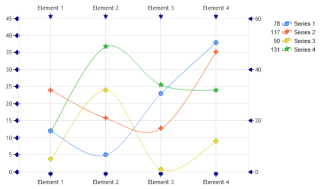
- JS Axis Series Ranges
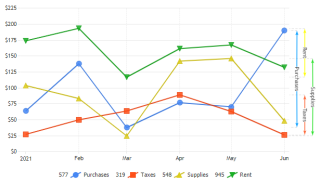
Demonstrates series value ranges with multiple y axes.
- JS Axis Tick Line Caps
This sample deomonstrates axis tick line caps.
- JS Range Tick Layout
Demonstrates Custom range ticks with multiple and offset axes.
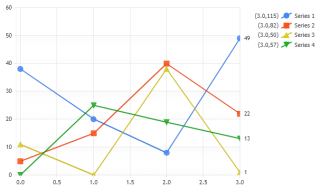
- JS Range Ticks On Series
Demonstrates series value ranges with multiple y axes.
- JS Axis Tick Icons
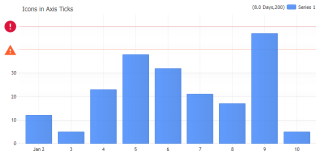
Demonstrates using icons in axis tick labels.
- JS Axis Calculated
Demonstrates multiple axes where one is based on the other.
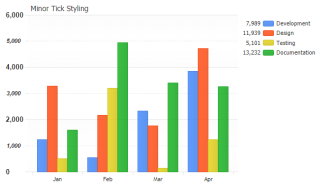
- JS Axis Minor Ticks
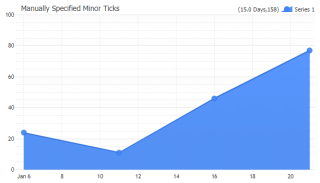
Demonstrates specifying a minor interval and minor ticks without a label.
- JS Axis Minor Ticks Trick
Demonstrates using minor ticks with different label styling.
- JS Axis Tick Angles
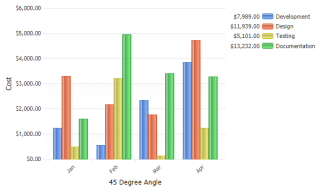
Demonstrates using angled x axis ticks on a JSC chart.
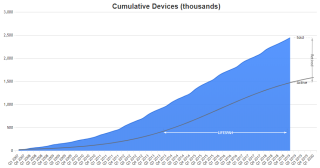
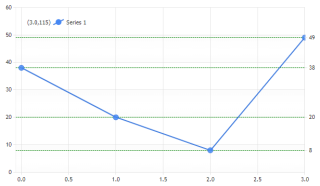
- JS Axis Shadow Calculated Ticks
Demonstrates using a shadow axis with calculated ticks.
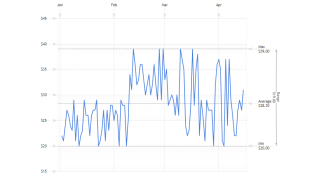
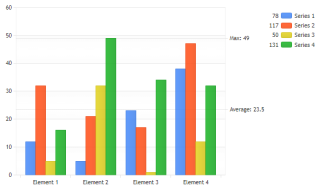
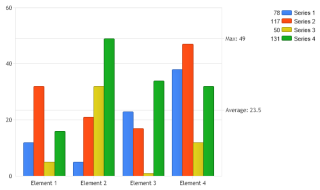
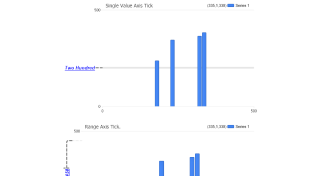
- JS Axis Shadow Important Ticks
Using a shadow axis to mark element values.
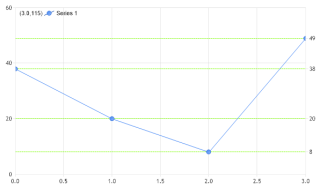
- JS Axis Shadow Series Last Values
Use a replica shadow axis to identify the last values of a series in JSCharting.
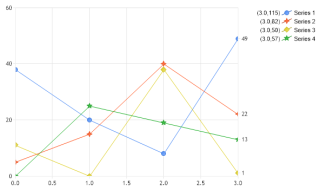
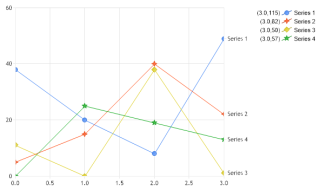
- JS Axis Shadow Series Names
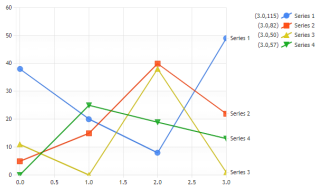
Use a replica shadow axis to identify series in JSCharting.
- JS Axis Shadow Token Ticks
Demonstrates dynamic calculated ticks that update in real-time with JSCharting.
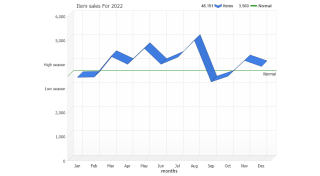
- JS Axis Tick Goal
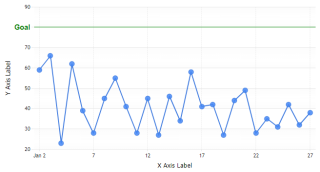
Demonstrates a custom tick with JSCharting and adjusting the axis range so it is always visible.
- JS Tick Placement
Demonstrates adding markers to series that dont use them by default.
- XAxis Label Angles
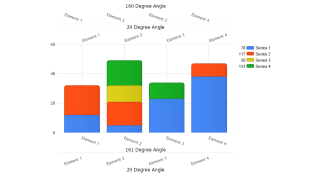
Demonstrates how to angle x axis labels.
- Axis Label Tokens
How dynamic tokens can be used by axis labels.
- Axis Label Alignment
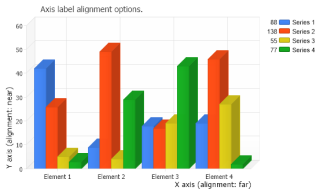
How axis labels are aligned.
- Interactive Unit Conversion
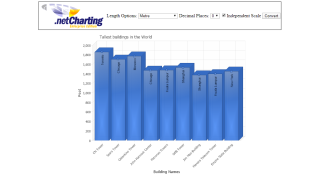
An interactive sample which demonstrates different axis unit conversions via a web interface.
- Axis Minor Ticks
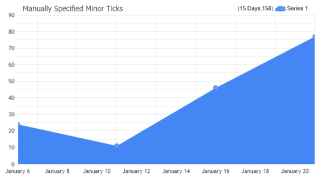
Manually specify minor ticks.
- Axis Smart Minor Ticks
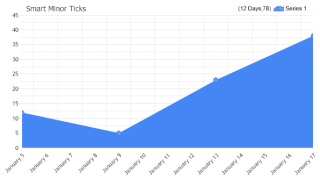
How smart minor ticks can be generated at relevant intervals automatically.
- Axis Minor Ticks Trick
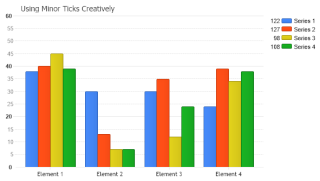
Using minor ticks in a different way.
- Axis Shadow Calculated Ticks
Demonstrates using a shadow axis with calculated ticks.
- Axis Shadow Important Ticks
Using a shadow axis to mark element values.
- Axis Shadow Series Last Values
Use a replica shadow axis to identify the last values of a series.
- Axis Shadow Series Names
Use a replica shadow axis to identify series.
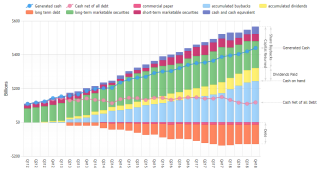
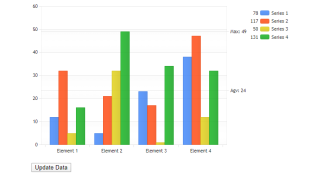
- Axis Shadow Series Values
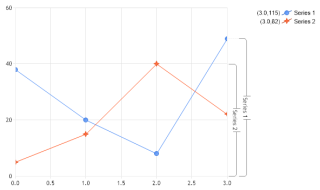
Using axis ticks to identify series and show their values.
- Axis Shadow Series Values 2
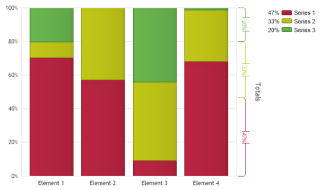
How axis ticks can show data totals.
- Axis Shadow Series Values 3
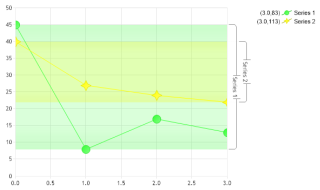
Using axis ticks to identify series and show their values.
- Axis Tick Alignment
How using different tick alignments.
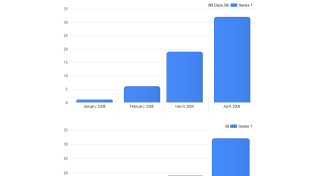
- Axis Tick Auto Add Range Time Labels
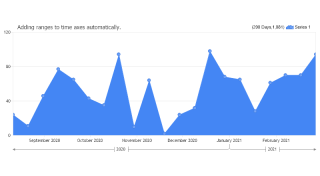
Use TimeLabelAutomationMode.AddRange time label automation to add axis time ranges automatically.
- Axis Tick Auto Range Time Labels
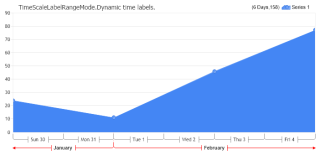
Use axis time label automation and how to specify different properties for time labels representing different instances in time.
- Axis Tick Auto Time Labels
Use axis time label automation and how to specify different properties for time labels representing different instances in time.
- Axis Tick Overrides
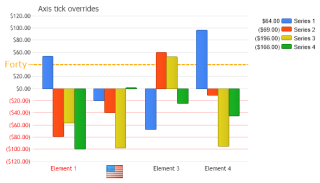
How axis ticks can be used to change the properties of other automatically generated ticks.
- Axis Tick Smart Time Labels
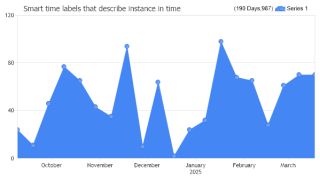
Using smart time labels.
- Axis Tick Token
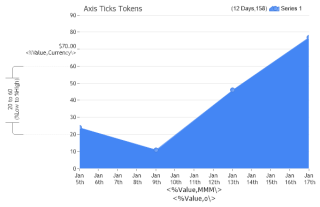
Use the %Value token with value axis ticks and manipulate their labels.
- Axis Tick Types
How different tick types can be used.
- Element Ticks
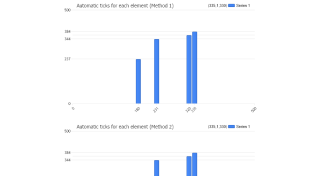
Demonstrates how axes can automatically generate ticks at each element's position and how to control each element's tick independently.
- Arbitrary Ticks
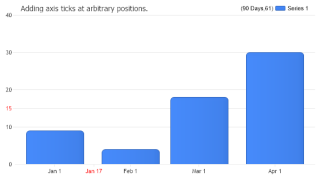
How ticks can be added at any position on an axis scale. A numeric tick is added to the y axis and a DateTime value tick is added to the x axis.
- Arbitrary Ticks 2
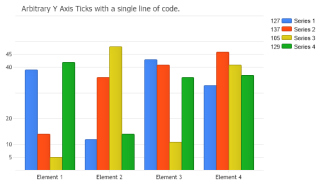
Adding arbitrary axis ticks using a shortcut.
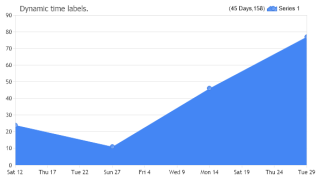
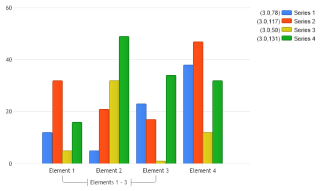
- Dynamic Ticks
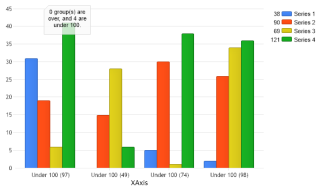
Create dynamic tick labels based on chart data.
- Axis Range Text Ticks
Demonstrates how range ticks can be used with a category x axis scale.
- Ticklabelmodes
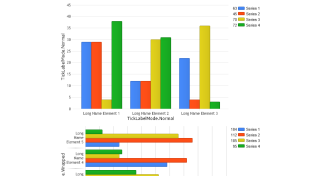
Demonstrates the usage of different axis tick label modes.
- Tick Separators
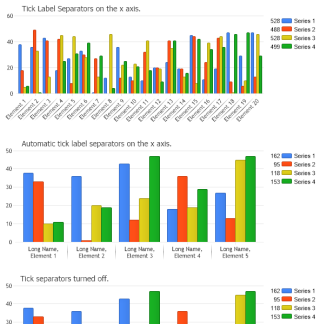
Work with tick label separators.
- Ranged Ticks
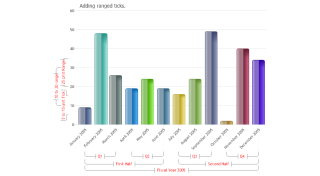
Usage of ranged ticks.
- Custom Function
Demonstrates the usage of a custom function to transform the axis tick labels.
- Axis Label Overrides
Demonstrates axis label text replacement.
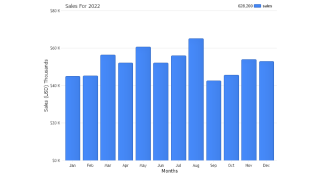
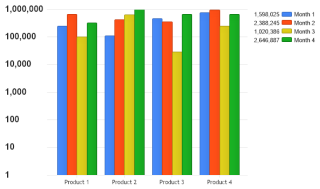
- Axis Tick Expressions
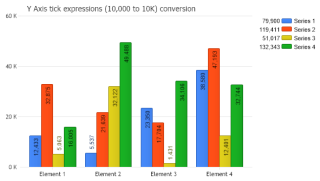
Demonstrates using expressions in y axis tick labels to change values like 10,000 to 10 K.
- Auto Time Range Row Limit
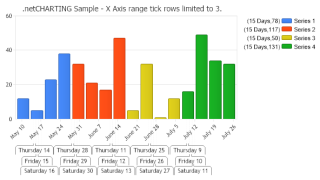
Demonstrates limiting the number of rows automatically generated range ticks span.
- Axis Category Range Ticks 1
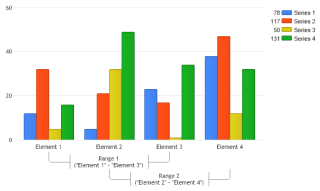
Demonstrates using range ticks for category axes referencing the existing ticks by name.
- Axis Category Range Ticks 2
Demonstrates using range ticks for category axes referencing the existing ticks by index numbers.
- Axis Tick Line Caps
Demonstrates using axis tick line caps.
- Smart Log Minor Ticks
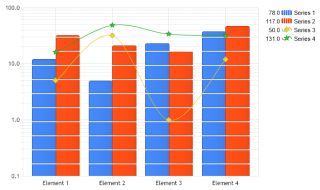
Demonstrates using smart minor ticks with logarithmic scale axes.
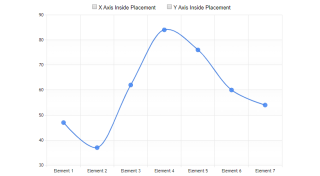
- Axis Tick Align
Demonstrates using a block tag to align Y axis tick labels.