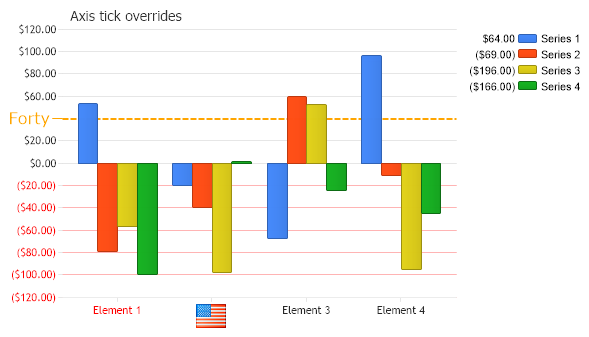
Gallery
Axis Tick Overrides
<%@ Page Language="C#" Description="dotnetCHARTING Component" %>
<%@ Register TagPrefix="dotnet" Namespace="dotnetCHARTING" Assembly="dotnetCHARTING"%>
<%@ Import Namespace="System.Drawing" %>
<%@ Import Namespace="System.Drawing.Drawing2D" %>
<html xmlns="http://www.w3.org/1999/xhtml">
<head>
<title>.netCHARTING Sample</title>
<script runat="server">
void Page_Load(Object sender,EventArgs e)
{
Chart.Type = ChartType.Combo;
Chart.Width = 600;
Chart.Height = 350;
Chart.TempDirectory = "temp";
Chart.Debug = true;
Chart.Title = "Axis tick overrides";
// Demonstrates how axis ticks can be
// used to change the properties of other automatically generated ticks.
// Sample shows:
// 1 - Overriding a numeric tick with text.
// 2 - Overriding a range of ticks with new properties
// 3 - Overriding a text tick.
//1. OVERRIDE NUMERIC TICK WITH TEXT
// Interval is set to ensure we have a tick a 40 and set a format
Chart.YAxis.Interval = 20;
Chart.YAxis.FormatString = "Currency";
// Setup the tick
AxisTick at = new AxisTick(40,"Forty");
// The rest of modifications are not necessary, just here for demo purposes.
at.Label.Font = new Font("Verdana",12);
at.Label.Color = Color.Orange;
at.Line.Length = 10;
at.Line.Color = Color.Orange;
at.GridLine.Color = Color.Orange;
at.GridLine.DashStyle = DashStyle.Dash;
at.GridLine.Width = 2;
//Add the tick
Chart.YAxis.ExtraTicks.Add(at);
// 2. OVERRIDE A NUMERIC RANGE
// Setup the tick. A dateTime range can also be used for time axes.
AxisTick at2 = new AxisTick(-1000,-1);
// This property will ensure the tick overrides the range instead of becoming a range tick.
at2.OverrideTicks = true;
// The rest of modifications are not necessary, just here for demo purposes.
at2.Label.Color = Color.Red;
at2.GridLine.Color = Color.FromArgb(75,Color.Red);
//Add the tick
Chart.YAxis.ExtraTicks.Add(at2);
// 3. OVERRIDE A TEXT TICK WITH TEXT
// Setup the tick.
AxisTick at3 = new AxisTick("Element 1");
// Override the tick label color setting.
at3.Label.Color = Color.Red;
// Add the tick
Chart.XAxis.ExtraTicks.Add(at3);
// 4. OVERRIDE A TEXT TICK WITH IMAGE
// Setup a single value axis tick and add it.
AxisTick at4 = new AxisTick("Element 2");
// The tick's Marker property is set with an image marker.
at4.Marker = new ElementMarker("../../images/us.png");
Chart.XAxis.ExtraTicks.Add(at4);
// 5. ADD DATA
// *DYNAMIC DATA NOTE*
// This sample uses random data to populate the chart. To populate
// a chart with database data see the following resources:
// - Classic samples folder
// - Help File > Data Tutorials
// - Sample: features/DataEngine.aspx
Chart.SeriesCollection.Add(getRandomData());
}
SeriesCollection getRandomData()
{
SeriesCollection SC = new SeriesCollection();
Random myR = new Random(2);
for(int a = 1; a < 5; a++)
{
Series s = new Series();
s.Name = "Series " + a;
for(int b = 1; b < 5; b++)
{
Element e = new Element();
e.Name = "Element " + b;
//e.YValue = -25 + myR.Next(50);
e.YValue = -100 + myR.Next(200);
s.Elements.Add(e);
}
SC.Add(s);
}
return SC;
}
</script>
</head>
<body>
<div style="text-align:center">
<dotnet:Chart id="Chart" runat="server" Width="568px" Height="344px">
</dotnet:Chart>
</div>
</body>
</html>
<%@ Page Language="vb" Description="dotnetCHARTING Component" %>
<%@ Register TagPrefix="dotnet" Namespace="dotnetCHARTING" Assembly="dotnetCHARTING"%>
<%@ Import Namespace="System.Drawing" %>
<%@ Import Namespace="System.Drawing.Drawing2D" %>
<html xmlns="http://www.w3.org/1999/xhtml">
<head>
<title>.netCHARTING Sample</title>
<script runat="server">
Sub Page_Load(ByVal sender As Object, ByVal e As EventArgs)
Chart.Type = ChartType.Combo
Chart.Width = 600
Chart.Height = 350
Chart.TempDirectory = "temp"
Chart.Debug = True
Chart.Title = "Axis tick overrides"
' Demonstrates how axis ticks can be
' used to change the properties of other automatically generated ticks.
' Sample shows:
' 1 - Overriding a numeric tick with text.
' 2 - Overriding a range of ticks with new properties
' 3 - Overriding a text tick.
'1. OVERRIDE NUMERIC TICK WITH TEXT
' Interval is set to ensure we have a tick a 40 and set a format
Chart.YAxis.Interval = 20
Chart.YAxis.FormatString = "Currency"
' Setup the tick
Dim at As AxisTick = New AxisTick(40,"Forty")
' The rest of modifications are not necessary, just here for demo purposes.
at.Label.Font = New Font("Verdana",12)
at.Label.Color = Color.Orange
at.Line.Length = 10
at.Line.Color = Color.Orange
at.GridLine.Color = Color.Orange
at.GridLine.DashStyle = DashStyle.Dash
at.GridLine.Width = 2
'Add the tick
Chart.YAxis.ExtraTicks.Add(at)
' 2. OVERRIDE A NUMERIC RANGE
' Setup the tick. A dateTime range can also be used for time axes.
Dim at2 As AxisTick = New AxisTick(-1000,-1)
' This property will ensure the tick overrides the range instead of becoming a range tick.
at2.OverrideTicks = True
' The rest of modifications are not necessary, just here for demo purposes.
at2.Label.Color = Color.Red
at2.GridLine.Color = Color.FromArgb(75,Color.Red)
'Add the tick
Chart.YAxis.ExtraTicks.Add(at2)
' 3. OVERRIDE A TEXT TICK WITH TEXT
' Setup the tick.
Dim at3 As AxisTick = New AxisTick("Element 1")
' Override the tick label color setting.
at3.Label.Color = Color.Red
' Add the tick
Chart.XAxis.ExtraTicks.Add(at3)
' 4. OVERRIDE A TEXT TICK WITH IMAGE
' Setup a single value axis tick and add it.
Dim at4 As AxisTick = New AxisTick("Element 2")
' The tick's Marker property is set with an image marker.
at4.Marker = New ElementMarker("../../images/us.png")
Chart.XAxis.ExtraTicks.Add(at4)
' 5. ADD DATA
' *DYNAMIC DATA NOTE*
' This sample uses random data to populate the chart. To populate
' a chart with database data see the following resources:
' - Classic samples folder
' - Help File > Data Tutorials
' - Sample: features/DataEngine.aspx
Chart.SeriesCollection.Add(getRandomData())
End Sub
Function getRandomData() As SeriesCollection
Dim SC As SeriesCollection = New SeriesCollection()
Dim myR As Random = New Random(2)
For a As Integer = 1 To 4
Dim s As Series = New Series()
s.Name = "Series " & a
For b As Integer = 1 To 4
Dim e As Element = New Element()
e.Name = "Element " & b
'e.YValue = -25 + myR.Next(50);
e.YValue = -100 + myR.Next(200)
s.Elements.Add(e)
Next b
SC.Add(s)
Next a
Return SC
End Function
</script>
</head>
<body>
<div style="text-align:center">
<dotnet:Chart id="Chart" runat="server" Width="568px" Height="344px">
</dotnet:Chart>
</div>
</body>
</html>
- Sample FilenameAxisTickOverrides.aspx
- VersionLegacy (Pre 3.0)
- Uses DatabaseNo