Gallery
Axis Tick Line Caps
<%@ Page Language="C#" Description="dotnetCHARTING Component" %>
<%@ Register TagPrefix="dotnet" Namespace="dotnetCHARTING" Assembly="dotnetCHARTING" %>
<%@ Import Namespace="System.Drawing" %>
<%@ Import Namespace="System.Drawing.Drawing2D" %>
<%@ Import Namespace="dotnetCHARTING.Mapping" %>
<script runat="server">
void Page_Load(Object sender, EventArgs e)
{
// Demonstrates using axis tick line caps.
Chart.TempDirectory = "temp";
Chart.Debug = true;
//Chart.LegacyMode = true;
Chart.Type = ChartType.Combo;
Chart.Size = "600x350";
//Chart.Title = ".netCHARTING Sample";
Chart.DefaultElement.Transparency = 20;
Chart.DefaultSeries.Type = SeriesType.Spline;
Chart.DefaultAxis.DefaultTick.Line.EndCap = LineCap.ArrowAnchor;
Chart.DefaultAxis.DefaultTick.Line.Length = 10;
Chart.DefaultAxis.DefaultTick.Line.Color = Color.DarkBlue;
Chart.DefaultAxis.DefaultTick.Line.AnchorCapScale = 4;
Axis yAxis2 = new Axis();
yAxis2.DefaultTick.Line.EndCap = LineCap.DiamondAnchor;
yAxis2.DefaultTick.Line.Length = 10;
Axis xAxis2 = new Axis();
xAxis2.DefaultTick.Line.EndCap = LineCap.RoundAnchor;
xAxis2.DefaultTick.Line.Length = 10;
Chart.YAxis.Orientation = dotnetCHARTING.Orientation.Right;
Chart.XAxis.Orientation = dotnetCHARTING.Orientation.Top;
// *DYNAMIC DATA NOTE*
// This sample uses random data to populate the chart. To populate
// a chart with database data see the following resources:
// - Use the getLiveData() method using the dataEngine to query a database.
// - Help File > Getting Started > Data Tutorials
// - DataEngine Class in the help file
// - Sample: features/DataEngine.aspx
SeriesCollection mySC = getRandomData();
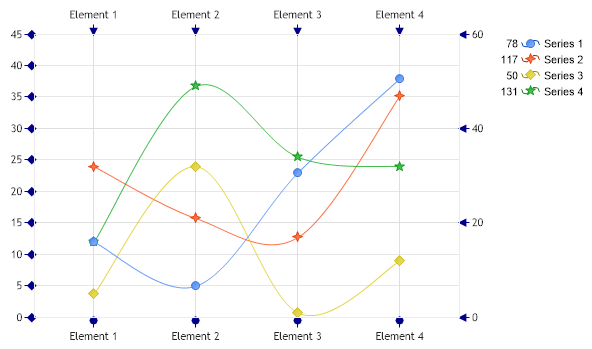
mySC[0].XAxis = xAxis2;
mySC[0].YAxis = yAxis2;
// Add the random data.
Chart.SeriesCollection.Add(mySC);
}
SeriesCollection getRandomData()
{
Random myR = new Random(1);
SeriesCollection SC = new SeriesCollection();
int a = 0;
int b = 0;
for (a = 1; a < 5; a++)
{
Series s = new Series("Series " + a.ToString());
for (b = 1; b < 5; b++)
{
Element e = new Element("Element " + b.ToString());
e.YValue = myR.Next(50);
s.Elements.Add(e);
}
SC.Add(s);
}
return SC;
}
SeriesCollection getLiveData()
{
DataEngine de = new DataEngine("ConnectionString goes here");
de.ChartObject = Chart; // Necessary to view any errors the dataEngine may throw.
de.SqlStatement = "SELECT XAxisColumn, YAxisColumn FROM ....";
return de.GetSeries();
}
</script>
<html xmlns="http://www.w3.org/1999/xhtml">
<head>
<title>.netCHARTING Sample</title>
</head>
<body>
<div align="center">
<dotnet:Chart ID="Chart" runat="server" />
</div>
</body>
</html>
<%@ Page Language="vb" Description="dotnetCHARTING Component" %>
<%@ Register TagPrefix="dotnet" Namespace="dotnetCHARTING" Assembly="dotnetCHARTING" %>
<%@ Import Namespace="System.Drawing" %>
<%@ Import Namespace="System.Drawing.Drawing2D" %>
<%@ Import Namespace="dotnetCHARTING.Mapping" %>
<script runat="server">
Sub Page_Load(ByVal sender As Object, ByVal e As EventArgs)
' Demonstrates using axis tick line caps.
Chart.TempDirectory = "temp"
Chart.Debug = True
'Chart.LegacyMode = true;
Chart.Type = ChartType.Combo
Chart.Size = "600x350"
'Chart.Title = ".netCHARTING Sample";
Chart.DefaultElement.Transparency = 20
Chart.DefaultSeries.Type = SeriesType.Spline
Chart.DefaultAxis.DefaultTick.Line.EndCap = LineCap.ArrowAnchor
Chart.DefaultAxis.DefaultTick.Line.Length = 10
Chart.DefaultAxis.DefaultTick.Line.Color = Color.DarkBlue
Chart.DefaultAxis.DefaultTick.Line.AnchorCapScale = 4
Dim yAxis2 As Axis = New Axis()
yAxis2.DefaultTick.Line.EndCap = LineCap.DiamondAnchor
yAxis2.DefaultTick.Line.Length = 10
Dim xAxis2 As Axis = New Axis()
xAxis2.DefaultTick.Line.EndCap = LineCap.RoundAnchor
xAxis2.DefaultTick.Line.Length = 10
Chart.YAxis.Orientation = dotnetCHARTING.Orientation.Right
Chart.XAxis.Orientation = dotnetCHARTING.Orientation.Top
' *DYNAMIC DATA NOTE*
' This sample uses random data to populate the chart. To populate
' a chart with database data see the following resources:
' - Use the getLiveData() method using the dataEngine to query a database.
' - Help File > Getting Started > Data Tutorials
' - DataEngine Class in the help file
' - Sample: features/DataEngine.aspx
Dim mySC As SeriesCollection = getRandomData()
mySC(0).XAxis = xAxis2
mySC(0).YAxis = yAxis2
' Add the random data.
Chart.SeriesCollection.Add(mySC)
End Sub
Function getRandomData() As SeriesCollection
Dim myR As Random = New Random(1)
Dim SC As SeriesCollection = New SeriesCollection()
Dim a As Integer = 0
Dim b As Integer = 0
For a = 1 To 4
Dim s As Series = New Series("Series " & a.ToString())
For b = 1 To 4
Dim e As Element = New Element("Element " & b.ToString())
e.YValue = myR.Next(50)
s.Elements.Add(e)
Next b
SC.Add(s)
Next a
Return SC
End Function
Function getLiveData() As SeriesCollection
Dim de As DataEngine = New DataEngine("ConnectionString goes here")
de.ChartObject = Chart ' Necessary to view any errors the dataEngine may throw.
de.SqlStatement = "SELECT XAxisColumn, YAxisColumn FROM ...."
Return de.GetSeries()
End Function
</script>
<html xmlns="http://www.w3.org/1999/xhtml">
<head>
<title>.netCHARTING Sample</title>
</head>
<body>
<div align="center">
<dotnet:Chart ID="Chart" runat="server" />
</div>
</body>
</html>
- Sample FilenameAxisTickLineCaps.aspx
- Version5.0
- Uses DatabaseNo