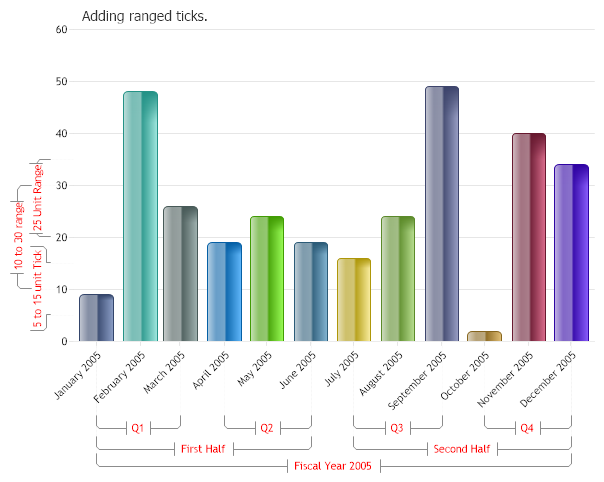
Ranged Ticks
Usage of ranged ticks.
<%@ Page Language="C#" Description="dotnetCHARTING Component" %>
<%@ Register TagPrefix="dotnet" Namespace="dotnetCHARTING" Assembly="dotnetCHARTING"%>
<%@ Import Namespace="System.Drawing" %>
<html xmlns="http://www.w3.org/1999/xhtml">
<head>
<title>.netCHARTING Sample</title>
<script runat="server">
void Page_Load(Object sender,EventArgs e)
{
Chart.Type = ChartType.Combo;
Chart.Width = 600;
Chart.Height = 500;
Chart.TempDirectory = "temp";
Chart.Debug = true;
Chart.Title = "Adding ranged ticks.";
Chart.LegendBox.Visible = false;
Chart.ShadingEffect = true;
Chart.ShadingEffectMode = ShadingEffectMode.Two;
// * INTRO *
// Demonstrates usage of ranged ticks
AxisTick at = new AxisTick(5,15);
at.Label.Color = Color.Red;
at.Label.Text = "5 to 15 unit Tick";
// Add it to the axis.
Chart.YAxis.ExtraTicks.Add(at);
AxisTick at2 = new AxisTick(35,20);
at2.Label.Color = Color.Red;
at2.Label.Text = "25 Unit Range";
// Add it to the axis.
Chart.YAxis.ExtraTicks.Add(at2);
AxisTick at3 = new AxisTick(10,30);
at3.Label.Color = Color.Red;
at3.Label.Text = "10 to 30 range";
// Add it to the axis.
Chart.YAxis.ExtraTicks.Add(at3);
AxisTick at4 = new AxisTick(new DateTime(2005,1,1),new DateTime(2005,3,1));
at4.Label.Color = Color.Red;
at4.Label.Text = "Q1";
Chart.XAxis.ExtraTicks.Add(at4);
AxisTick at5 = new AxisTick(new DateTime(2005,4,1),new DateTime(2005,6,1));
at5.Label.Color = Color.Red;
at5.Label.Text = "Q2";
Chart.XAxis.ExtraTicks.Add(at5);
AxisTick at6 = new AxisTick(new DateTime(2005,7,1),new DateTime(2005,9,1));
at6.Label.Color = Color.Red;
at6.Label.Text = "Q3";
Chart.XAxis.ExtraTicks.Add(at6);
AxisTick at7 = new AxisTick(new DateTime(2005,10,1),new DateTime(2005,12,1));
at7.Label.Color = Color.Red;
at7.Label.Text = "Q4";
Chart.XAxis.ExtraTicks.Add(at7);
AxisTick at8 = new AxisTick(new DateTime(2005,1,1),new DateTime(2005,6,1));
at8.Label.Color = Color.Red;
at8.Label.Text = "First Half";
Chart.XAxis.ExtraTicks.Add(at8);
AxisTick at9 = new AxisTick(new DateTime(2005,7,1),new DateTime(2005,12,1));
at9.Label.Color = Color.Red;
at9.Label.Text = "Second Half";
Chart.XAxis.ExtraTicks.Add(at9);
AxisTick at10 = new AxisTick(new DateTime(2005,1,1),new DateTime(2005,12,1));
at10.Label.Color = Color.Red;
at10.Label.Text = "Fiscal Year 2005";
Chart.XAxis.ExtraTicks.Add(at10);
// 3. GET DATA
// *DYNAMIC DATA NOTE*
// This sample uses random data to populate the chart. For information on acquiring
// database data see the following resources:
// - Classic samples folder
// - Help File > Data Tutorials
// - Sample: features/DataEngine.aspx
// Add the random data.
Chart.SeriesCollection.Add(getRandomData());
}
SeriesCollection getRandomData()
{
Random myR = new Random();
SeriesCollection SC = new SeriesCollection();
DateTime dt = new DateTime(2005,1,1);
Series s = new Series();
for(int b = 0; b < 12; b++)
{
Element e = new Element();
e.XDateTime = dt;
dt = dt.AddMonths(1);
e.YValue = myR.Next(50);
s.Elements.Add(e);
}
// give each series element its own color
s.PaletteName = Palette.Two;
SC.Add(s);
return SC;
}
</script>
</head>
<body>
<div style="text-align:center">
<dotnet:Chart id="Chart" runat="server" Width="568px" Height="344px">
</dotnet:Chart>
</div>
</body>
</html>
<%@ Page Language="vb" Description="dotnetCHARTING Component" %>
<%@ Register TagPrefix="dotnet" Namespace="dotnetCHARTING" Assembly="dotnetCHARTING"%>
<%@ Import Namespace="System.Drawing" %>
<html xmlns="http://www.w3.org/1999/xhtml">
<head>
<title>.netCHARTING Sample</title>
<script runat="server">
Sub Page_Load(ByVal sender As Object, ByVal e As EventArgs)
Chart.Type = ChartType.Combo
Chart.Width = 600
Chart.Height = 500
Chart.TempDirectory = "temp"
Chart.Debug = True
Chart.Title = "Adding ranged ticks."
Chart.LegendBox.Visible = False
Chart.ShadingEffect = True
Chart.ShadingEffectMode = ShadingEffectMode.Two
' * INTRO *
' Demonstrates usage of ranged ticks
Dim at As AxisTick = New AxisTick(5,15)
at.Label.Color = Color.Red
at.Label.Text = "5 to 15 unit Tick"
' Add it to the axis.
Chart.YAxis.ExtraTicks.Add(at)
Dim at2 As AxisTick = New AxisTick(35,20)
at2.Label.Color = Color.Red
at2.Label.Text = "25 Unit Range"
' Add it to the axis.
Chart.YAxis.ExtraTicks.Add(at2)
Dim at3 As AxisTick = New AxisTick(10,30)
at3.Label.Color = Color.Red
at3.Label.Text = "10 to 30 range"
' Add it to the axis.
Chart.YAxis.ExtraTicks.Add(at3)
Dim at4 As AxisTick = New AxisTick(New DateTime(2005,1,1),New DateTime(2005,3,1))
at4.Label.Color = Color.Red
at4.Label.Text = "Q1"
Chart.XAxis.ExtraTicks.Add(at4)
Dim at5 As AxisTick = New AxisTick(New DateTime(2005,4,1),New DateTime(2005,6,1))
at5.Label.Color = Color.Red
at5.Label.Text = "Q2"
Chart.XAxis.ExtraTicks.Add(at5)
Dim at6 As AxisTick = New AxisTick(New DateTime(2005,7,1),New DateTime(2005,9,1))
at6.Label.Color = Color.Red
at6.Label.Text = "Q3"
Chart.XAxis.ExtraTicks.Add(at6)
Dim at7 As AxisTick = New AxisTick(New DateTime(2005,10,1),New DateTime(2005,12,1))
at7.Label.Color = Color.Red
at7.Label.Text = "Q4"
Chart.XAxis.ExtraTicks.Add(at7)
Dim at8 As AxisTick = New AxisTick(New DateTime(2005,1,1),New DateTime(2005,6,1))
at8.Label.Color = Color.Red
at8.Label.Text = "First Half"
Chart.XAxis.ExtraTicks.Add(at8)
Dim at9 As AxisTick = New AxisTick(New DateTime(2005,7,1),New DateTime(2005,12,1))
at9.Label.Color = Color.Red
at9.Label.Text = "Second Half"
Chart.XAxis.ExtraTicks.Add(at9)
Dim at10 As AxisTick = New AxisTick(New DateTime(2005,1,1),New DateTime(2005,12,1))
at10.Label.Color = Color.Red
at10.Label.Text = "Fiscal Year 2005"
Chart.XAxis.ExtraTicks.Add(at10)
' 3. GET DATA
' *DYNAMIC DATA NOTE*
' This sample uses random data to populate the chart. For information on acquiring
' database data see the following resources:
' - Classic samples folder
' - Help File > Data Tutorials
' - Sample: features/DataEngine.aspx
' Add the random data.
Chart.SeriesCollection.Add(getRandomData())
End Sub
Function getRandomData() As SeriesCollection
Dim myR As Random = New Random()
Dim SC As SeriesCollection = New SeriesCollection()
Dim dt As DateTime = New DateTime(2005,1,1)
Dim s As Series = New Series()
For b As Integer = 0 To 11
Dim e As Element = New Element()
e.XDateTime = dt
dt = dt.AddMonths(1)
e.YValue = myR.Next(50)
s.Elements.Add(e)
Next b
' give each series element its own color
s.PaletteName = Palette.Two
SC.Add(s)
Return SC
End Function
</script>
</head>
<body>
<div style="text-align:center">
<dotnet:Chart id="Chart" runat="server" Width="568px" Height="344px">
</dotnet:Chart>
</div>
</body>
</html>